Chapter 1. Introduction
RAPx is a static analysis platform for Rust programs with two objectives:
- To serve as a companion to the Rust compiler in detecting semantic bugs related to unsafe code.
- To provide ready-to-use program analysis features for tool developers.
Although Rust has made significant progress in ensuring memory safety and protecting software from undefined behavior, the Rust compiler's capability is inherently limited due to Rice's theorem. In general, it refrains from detecting undefined behaviors related to unsafe code, as achieving both precise and efficient analysis is extremely challenging. This limitation arises because the Rust compiler prioritizes usability, as developers cannot tolerate false positives. RAPx is not bound by this constraint. It may produce false positives, as long as they remain within an acceptable range.
Writing program analysis tools is challenging. In this project, we also aim to provide a user-friendly framework for developing new static program analysis features for Rust. In particular, our project integrates dozens of classic program analysis algorithms, including those for pointer analysis, value-flow analysis, control-flow analysis, and more. Developers can choose and combine them like Lego blocks to achieve new bug detection or verification capabilities.
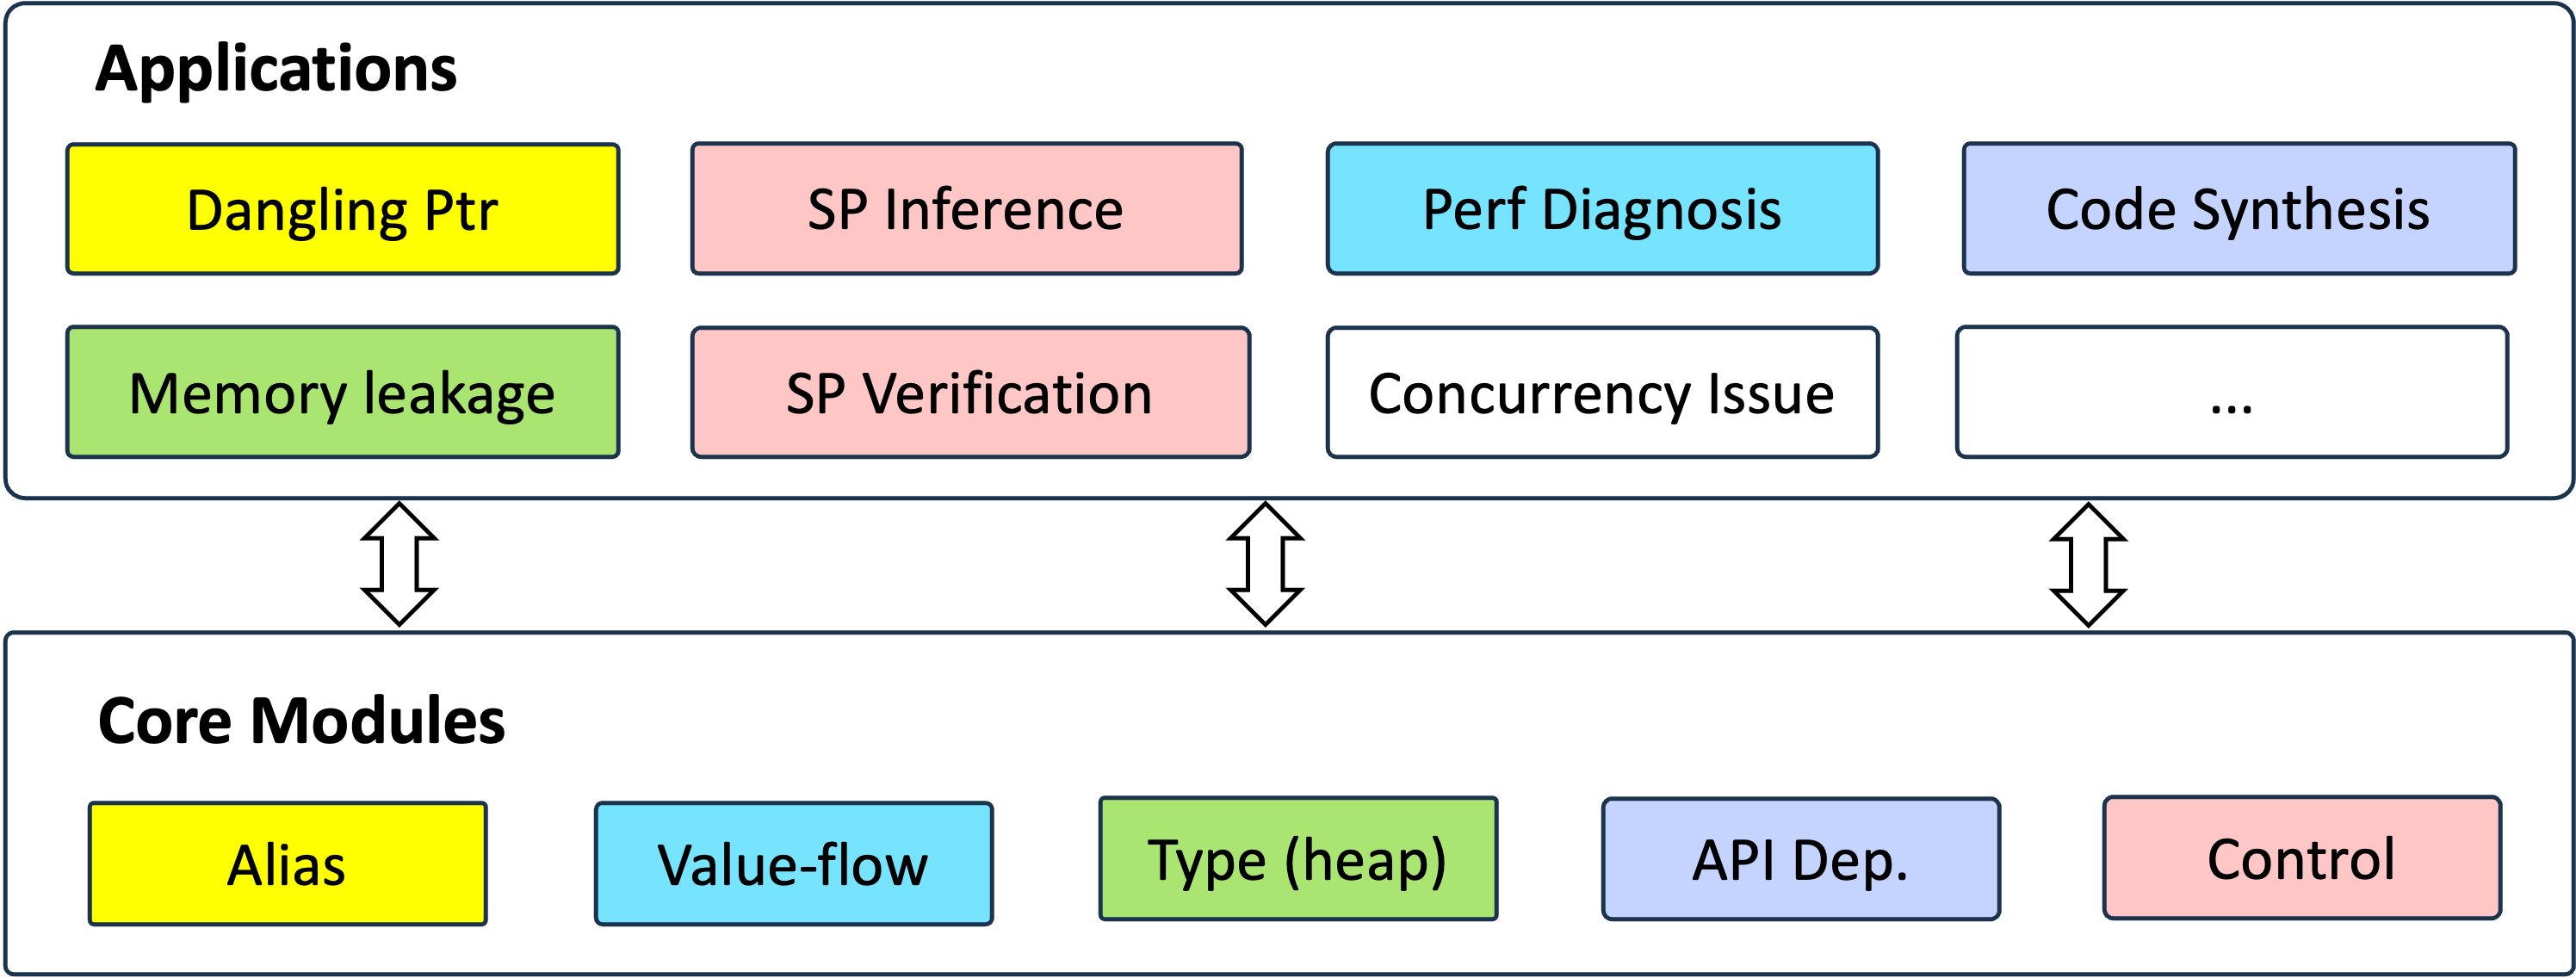
The following figure demonstrates the framework of RAPx, which is composed of a core layer and an application layer. The project repository of RAPx can be found here. Note that the project is still under heavy development, and some modules are not available yet.
Chapter 2. Installation and Usage Guide
Platform Support
- Linux
- macOS (both x86_64 and aarch64 version)
Preparation
The latest RAPx is developped based on Rust version nightly-2024-08-05. You can install this version using the following command.
rustup toolchain install nightly-2025-12-06 --profile minimal --component rustc-dev,rust-src,llvm-tools-preview
If you have multiple Rust versions, please ensure the default version is set to nightly-2025-12-06.
rustup show
Install
Download the project
git clone https://github.com/Artisan-Lab/RAPx.git
Build and install RAPx
./install.sh
You can combine the previous two steps into a single command:
cargo +nightly-2025-12-06 install rapx --git https://github.com/Artisan-Lab/RAPx.git
For macOS users, you may encounter compilation errors related to Z3 headers and libraries. There are two solutions:
The first one is to manually export the headers and libraries as follows:
export C_INCLUDE_PATH=/opt/homebrew/Cellar/z3/VERSION/include:$C_INCLUDE_PATH
ln -s /opt/homebrew/Cellar/z3/VERSION/lib/libz3.dylib /usr/local/lib/libz3.dylib
Alternatively, you can modify the Cargo.toml file to change the dependency of Z3 to use static linkage. However, this may significantly slow down the installation process, so we do not recommend enabling this option by default.
[dependencies]
z3 = {version="0.13.3", features = ["static-link-z3"]}
After this step, you should be able to see the RAPx plugin for cargo.
cargo --list
Execute the following command to run RAPx and print the help message:
cargo rapx -help
Usage:
    cargo rapx [rapx options] -- [cargo check options]

RAPx Options:

Application:
    -F or -uaf      use-after-free/double free detection.
    -M or -mleak    memory leakage detection.
    -O or -opt      automatically detect code optimization chances.
    -I or -infer    (under development) infer the safety properties required by unsafe APIs.
    -V or -verify   (under development) verify if the safety requirements of unsafe API are satisfied.

Analysis:
    -alias          perform alias analysis (meet-over-paths)
    -adg            generate API dependency graphs
    -callgraph      generate callgraphs
    -dataflow       (not supported yet) generate dataflow graphs
    -heap           analyze if the type holds a piece of memory on heap
    -audit          (under development) generate unsafe code audit units
...
Uninstall
cargo uninstall rapx
Chapter 3. Framework of RAPx
Traditionally, performing code analysis requires modifying the compiler source code to add new passes. Developers then need to recompile the compiler to activate these new passes, which can be cumbersome. The Rust compiler offers a more portable way to conduct code analysis using the rustc_driver. We refer to this approach as the frontend method because it allows developers to directly access internal compiler data and perform analysis as callbacks.
Custom Cargo Commands
To support project-level program analysis, we want the analysis tool to be integrated into cargo as subcommands. To this end, we can name the tool as cargo-toolname and place it in $CARGO_HOME/bin or $PATH. Then we can execute the tool via the following command.
cargo toolname -more_arguments
Cargo will automatically search the binaries named cargo-toolname from the paths. The following figure demonstrates the whole process before reaching our analysis program.
 Note that we cannot directly invoke rapx in the first round but through cargo check because we need cargo to manage the project-level compilation and append detailed compilation options for launching rustc. However, we want to hook rustc execution and execute rapx instead for analysis. Therefore, we set RUSTC_WRAPPER with the value of cargo-rapx. In this way, cargo check will actually run
 cargo-rapx rustc appended_options. We then dispath the execution to rapx with appended options.
Register Analysis Callbacks
Supposing the purpose is to execute a function named my_analysis, developers should design a new struct and implement the Callbacks Trait for the struct.
#![allow(unused)]
fn main() {
pub struct MyCallback {...}
impl Callbacks for MyCallback {
    fn after_analysis<'tcx>(&mut self, compiler: &Compiler, queries: &'tcx Queries<'tcx>) -> Compilation {
        compiler.session().abort_if_errors();
        queries.global_ctxt().unwrap().enter(
            |tcx| my_analysis(tcx, *self) // the analysis function to execute after compilation.
        );
        compiler.session().abort_if_errors();
        Compilation::Continue
    }
}
}
To execute the compiler and callback function, developers can employ the APIs rustc_driver::RunCompiler provided by Rust.
#![allow(unused)]

fn main() {
let mut callback = MyCallback::default();
let run_compiler = rustc_driver::RunCompiler::new(&args, callback);
let exit_code = rustc_driver::catch_with_exit_code(move || run_compiler.run());
}
Chatper 4. Preliminary: Compiler Internals
IR
Our analysis platform is primarily based on two forms of Rust intermediate representations: HIR and MIR.
- HIR: An AST-like, type-checked, high-level intermediate representation that closely follows Rust’s surface syntax while eliminating syntactic sugar.
- MIR: A LLVM-IR-like, mid-level intermediate representation designed to simplify borrow checking, optimization, and program analysis. Note that MIR is not SSA.
You can obtain the HIR or MIR of a Rust source file by executing the following commands:
cargo rustc -- -Z unpretty=hir-tree
cargo rustc -- -Zunpretty=mir
Key Terms and Usages
- TyCtxt: It is the central data structure of Rust compilers. We can obtain the hir or mir of a function based on the object.
- DefId: It is a globally unique identifier that identifies an item (such as a function, type, trait, or impl) across all crates by pairing a crate identifier with a definition index.
- LocalDefId: A crate-local identifier that is equivalent to a DefId with
krate == LOCAL_CRATE. UnlikeDefId, it does not carry a crate identifier and therefore cannot refer to definitions from external crates. - Place: An abstract memory location in MIR. A Place describes where a value is stored or accessed, consisting of a base (such as a local variable or static) and a projection path (e.g., field access, dereference, indexing).
- Local: An index identifying a local variable in a MIR body, such as function parameters, temporaries, or user-declared variables.
To obtain the mir of a function.
#![allow(unused)]
fn main() {
let mir = optimized_mir(def_id);
}
To obtain the body of a function.
#![allow(unused)]
fn main() {
let body = self.tcx.optimized_mir(def_id);
}
#![allow(unused)]
fn main() {
let mut ty = body.local_decls[local].ty;
}
Chapter 5. Core Modules
This chapter introduces the core modules of RAPx, which implements several commonly used program analysis features, including alias analysis, dataflow analysis, control-flow analysis, and more. Please refer to the corresponding sub-chapters for more information.
Since many static analysis tasks are inherently undecidable due to the limitations of Rice’s Theorem, the core module adopts a layered design that enable users to customize their own analysis routines.
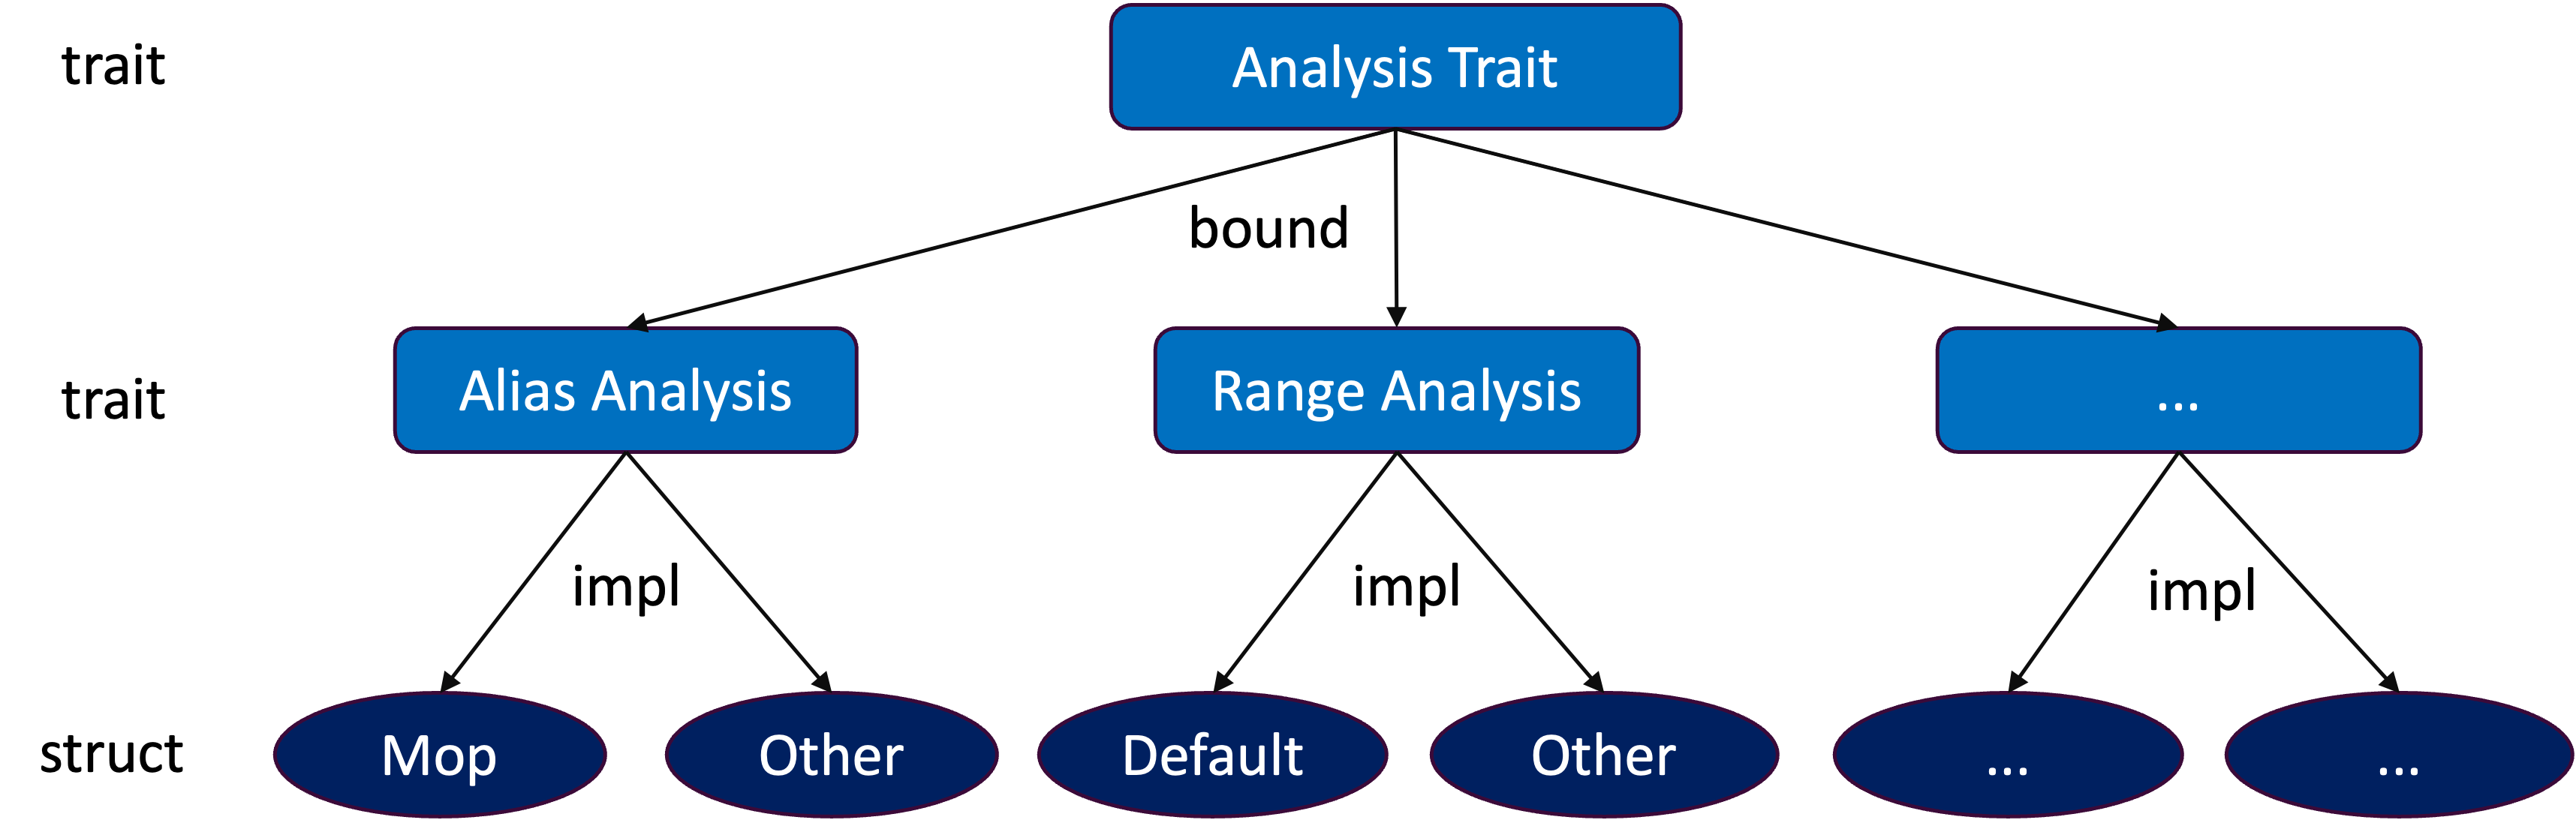
As shown in the above figure, the top level defines an Analysis trait, and each analysis feature is implemented as a subtrait that is bounded by the Analysis trait. For each feature, RAPx provides a default implementation via a corresponding struct. Users can utilize a feature by creating an instance of the struct and invoking the run method defined in the Analysis trait.
#![allow(unused)]
fn main() {
pub trait Analysis {
    fn name(&self) -> &'static str;
    fn run(&mut self);
}

pub trait AnalysisFeature: Analysis {
    // APIs related to the AnalysisFeature
}

pub struct MyAnalysisFeature {
    // APIs of the struct
}

impl Analysis for MyAnalysisFeature { ... }
impl AnalysisFeature for MyAnalysisFeature { ... }
}
Chapter 5.1. Alias Analysis
Alias analysis involves determining if two identifiers point to the same memory allocation. The task is challenging, with various options that balance precision and cost, including flow sensitivity, field sensitivity, and path sensitivity. In general, there are two main approaches to analysis: the lattice-based approach and the meet-over-all-paths (MOP) approach.
5.1.1 Alias Analysis Trait
RAPx provides the AliasAnalysis trait for alias analysis. The trait has several methods, which enables users to query the aliases among the arguments and return value of a function based on the function DefId, or the aliases of all functions as a FxHashMap. Developers can implement the trait based on their needs.
#![allow(unused)]
fn main() {
pub trait AliasAnalysis: Analysis {
    fn get_fn_alias(&self, def_id: DefId) -> Option<FnAliasPairs>;
    fn get_all_fn_alias(&self) -> FnAliasMap;
    fn get_local_fn_alias(&self) -> FnAliasMap;
}
}
The alias analysis result for each function is stored as the FnAliasPairs type, which contains a HashSet of multiple alias relationships, and each alias relationship is recorded as AliasPair.
#![allow(unused)]
fn main() {
pub struct FnAliasPairs {
    arg_size: usize,
    alias_set: HashSet<AliasPair>,
}
pub struct AliasPair {
    pub left_local: usize, // parameter id; the id of return value is `0`;
    pub lhs_fields: Vec<usize>, // field-sensive: sequence of (sub) field numbers for left_local
    pub right_local: usize, // parameter id, which is an alias of left_local
    pub rhs_fields: Vec<usize>, // field-sensive: sequence of (sub) field numbers for right_local
}
}
RAPx has implemented a default alias analysis algorithm based on MOP.
5.1.2 Default Alias Analysis
The MOP-based alias approach is achieved via a struct AliasAnalyzer, which implements the AliasAnalysis trait. The detailed implementation can be found in mop.rs.
#![allow(unused)]
fn main() {
pub struct AliasAnalyzer<'tcx> {
    pub tcx: TyCtxt<'tcx>,
    pub fn_map: FxHashMap<DefId, MopFnAliasPairs>,
}
}
The results can be retrieved by decoding the data structure of FnAliasPairs .
Suposing the task is to analyze the alias relationship among the return values and the arguments, the approach performs alias analysis for each execution path of a target function and merges the results from different paths into a final result. When encountering function calls, it recursively analyzes the callees until all dependencies are resolved. This approach is path-sensitive and field-sensitive but context-insensitive.
5.1.2.1 Feature: Path Sensitive with Light Reachability Constraints
In the following code, there are two conditional branches. If adopting a lattice-based approach, a could be an alias of either x or y at program point ①. Consequently, the return value could also be an alias of either x or y.
However, this analysis is inaccurate, and a cannot be an alias of y in this program.
In fact, the function foo has four execution paths induced by the two conditional branches. Among them, only one path involves an alias relationship between the return value and y. This path requires choice to be Selector::Second in the first conditional statement and Selector::First in the second conditional statement, which is impossible. Therefore, this path is unreachable, and a should not be considered an alias of y in this program.
#![allow(unused)]
fn main() {
enum Selector {
    First,
    Second,
}

fn foo<'a>(x: &'a i32, y: &'a i32, choice: Selector) -> &'a i32 {
    let a = match choice {
        Selector::First => x,
        Selector::Second => y,
    };
    // program point ①.
    match choice {
        Selector::First => a,
        Selector::Second => x,
    }
}
}
Our MOP-based approach can address this issue by explicitly extracting each execution path and justifying its reachability through the maintenance of a set of constant constraints.
We use the following MIR code for illustration, which corresponds to the previous source code. In bb0, there is a SwitchInt() instruction that branches control flow to bb3 if _5 is 0, to bb1 if _5 is 1, or to bb2 otherwise.
Accordingly, we impose constant constraints on _5 along each branch: in bb3, _5 is constrained to be 0; in bb1, _5 is constrained to be 1; and in bb2, _5 is constrained to be neither 0 nor 1. With these constraints in place, when execution reaches the second conditional statement in bb4, the analysis can rule out two unreachable combinations of branch conditions.
#![allow(unused)]
fn main() {
fn foo(_1: &i32, _2: &i32, _3: Selector) -> &i32 {
    bb0: {
        StorageLive(_4);
        _5 = discriminant(_3);
        switchInt(move _5) -> [0: bb3, 1: bb1, otherwise: bb2];
    }

    bb1: {
        _4 = _2;
        goto -> bb4;
    }

    bb2: {
        unreachable;
    }

    bb3: {
        _4 = _1;
        goto -> bb4;
    }

    bb4: {
        _6 = discriminant(_3);
        switchInt(move _6) -> [0: bb6, 1: bb5, otherwise: bb2];
    }

    bb5: {
        _0 = _1;
        goto -> bb7;
    }

    bb6: {
        _0 = _4;
        goto -> bb7;
    }

    bb7: {
        StorageDead(_4);
        return;
    }
}
}
5.1.2.2 SCC Handling
A major challenge for path-sensitive analysis lies in the presence of strongly connected components (SCCs), since loops may induce an unbounded number of execution paths. We address this challenge based on the following two observations:
- Each SCC in MIR has a dominator, i.e., every loop in MIR is a natural loop. This property allows us to construct SCC trees that capture the hierarchical structure of loops.
- Traversing the same loop path once or multiple times does not change the resulting alias relationships.
Based on these observations, we can soundly bound path exploration by collapsing repetitive loop traversals. In the following, we use a concrete example to demonstrate how these findings enable efficient and precise path enumeration in the presence of loops.
#![allow(unused)]
fn main() {
enum Selector {
    First,
    Second,
}

// Expected alias analysis result: (0, 1) (0, 2)
fn foo(x: *mut i32, y: *mut i32, choice: Selector) -> *mut i32 {
    let mut r = x;
    let mut q = x;

    unsafe {
        while *r > 0 {
            let mut p = match choice {
                Selector::First => y,
                Selector::Second => x,
            };

            loop {
                r = q;
                q = match choice {
                    Selector::First => x,
                    Selector::Second => p,
                };
                *q -= 1;
                if *r <= 1 {
                    break;
                }
                q = y;
            }

            if *r == 0 {
                break;
            }
        }
    }

    r
}
}
The following figure illustrates the control-flow graph of the code.
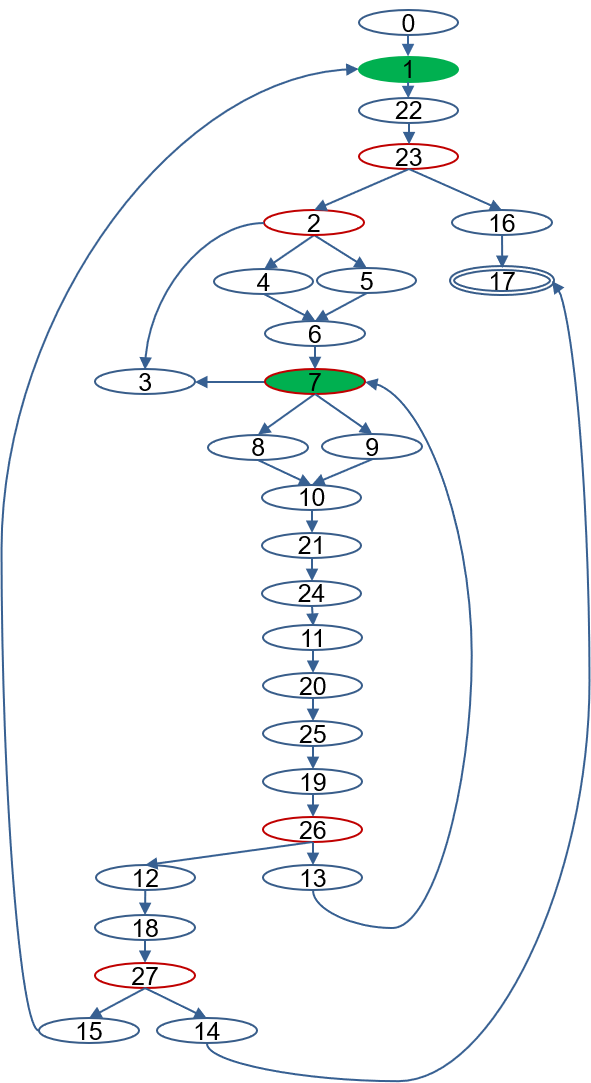
There is a large SCC
{1, 22, 23, 2, 4, 5, 6, 7, 8, 9, 10, 21, 24, 11, 20, 25, 19, 26, 13, 12, 18, 27, 15},
whose dominator is node 1, since every path from the entry node to any node in this SCC must pass through 1.
Next, we identify sub-SCCs by removing the dominator of the SCC. Starting from node 22, which is a successor of the removed dominator 1, we discover a sub-SCC
{7, 8, 9, 10, 21, 24, 11, 20, 25, 19, 26, 13},
with dominator 7.
These two dominators form a hierarchical relationship. In practice, an SCC may contain multiple sub-SCCs, and sub-SCCs may themselves contain further nested SCCs. This naturally yields a tree structure that represents multi-level SCC nesting.
In this way, we enumerate valuable paths of an SCC tree in a recursive manner. We define a path as a sequence from the dominator to an exit of the corresponding sub-SCC. For example, 7-8-10-21-24-11-20-25-19-26 is such a path.
A node sequence is worth further exploration only if the most recent traversal between two occurrences of the same dominator introduces at least one previously unvisited node. For instance,
7-8-10-21-24-11-20-25-19-13-7-8-10-21-24-11-20-25-19-13-7 is not worth exploring, since the second segment is a duplication of the first and does not introduce any new nodes.
In contrast, 7-8-10-21-24-11-20-25-19-13-7-9-10-21-24-11-20-25-19-13-7 is worth exploring because the second segment introduces a new node 9, which may lead to new alias relationships. The resulting path is
7-8-10-21-24-11-20-25-19-13-7-9-10-21-24-11-20-25-19-13-7-8-10-21-24-11-20-25-19-26.
Using this strategy, our approach generates the following 10 paths for the inner SCC.
7-8-10-21-24-11-20-25-19-267-9-10-21-24-11-20-25-19-267-8-10-21-24-11-20-25-19-13-7-8-10-21-24-11-20-25-19-267-8-10-21-24-11-20-25-19-13-7-9-10-21-24-11-20-25-19-267-9-10-21-24-11-20-25-19-13-7-8-10-21-24-11-20-25-19-267-9-10-21-24-11-20-25-19-13-7-9-10-21-24-11-20-25-19-267-8-10-21-24-11-20-25-19-13-7-9-10-21-24-11-20-25-19-13-7-8-10-21-24-11-20-25-19-267-8-10-21-24-11-20-25-19-13-7-9-10-21-24-11-20-25-19-13-7-9-10-21-24-11-20-25-19-267-9-10-21-24-11-20-25-19-13-7-8-10-21-24-11-20-25-19-13-7-8-10-21-24-11-20-25-19-267-9-10-21-24-11-20-25-19-13-7-8-10-21-24-11-20-25-19-13-7-9-10-21-24-11-20-25-19-26
Note that this path enumeration strategy can effectively detect the alias relationship between r and y, for example via the path 7-9-10-21-24-11-20-25-19-13-7-9-10-21-24-11-20-25-19-26.
In contrast, a straightforward DFS-based traversal fails to detect this alias relationship.
Our analysis adopts a recursive strategy instead of an iterative bottom-up approach. A purely bottom-up method, although potentially more efficient, ignores path constraints introduced outside an SCC and may therefore over-approximate reachable paths. To address this limitation, our analysis starts from the outermost SCC and proceeds inward. When the analysis reaches an inner SCC, it propagates the accumulated path constraints from the outer context and uses them to determine which of the 10 inner-SCC paths are reachable. For each reachable path, the analysis then concatenates the corresponding inner-SCC subsequence with the path of the outer SCC, continuing the exploration.
5.1.2.3 Feature: Field Sensitive
In the following example, the return value of foo() is an alias of the first field of its first argument.
#![allow(unused)]
fn main() {
struct Point {
    x: i32,
    y: i32,
}

fn foo(p1: &Point) -> &i32 {
    &p1.y
}
}
The corresponding MIR code is as follows:
#![allow(unused)]
fn main() {
fn foo(_1: &Point) -> &i32 {
   bb0: {
        _0 = &((*_1).1: i32);
        return;
    }
}
}
The alias analysis result should be (0, 1.1).
5.1.3 Quick Usage Guide
Developers can test the feature using the following command:
cargo rapx -alias
For example, we can apply the mop analysis to the first case, and the result is as follows:
Checking alias_mop_field...
21:50:18|RAP|INFO|: Start analysis with RAP.
21:50:18|RAP|INFO|: Alias found in Some("::boxed::{impl#0}::new"): {(0.0,1)}
21:50:18|RAP|INFO|: Alias found in Some("::foo"): {(0,1.1),(0,1.0)}
When applying the mop analysis to the first case, and the result is as follows:
Checking alias_mop_switch...
21:53:37|RAP|INFO|: Start analysis with RAP.
21:53:37|RAP|INFO|: Alias found in Some("::foo"): {(0,2),(0,1)}
21:53:37|RAP|INFO|: Alias found in Some("::boxed::{impl#0}::new"): {(0.0,1)}
To utilize the analysis results in other analytical features, developers can refer the following example:
#![allow(unused)]
fn main() {
let mut alias_analysis = AliasAnalyzer::new(self.tcx);
alias_analysis.run();
let result = alias_analysis.get_local_fn_alias();
rap_info!("{}", AAResultMapWrapper(result));
}
The code above performs alias analysis for each function, recording the alias pairs between two arguments or between an argument and the return value.
Key Steps of Our Algorithm
There are three key steps (source code):
#![allow(unused)]
fn main() {
let mut mop_graph = MopGraph::new(self.tcx, def_id);
mop_graph.solve_scc();
mop_graph.check(0, &mut self.fn_map);
}
- Graph preparation: Construct the control-flow graph for the target function. See the source code.
- SCC shrinkage: Extract the strongly connected components (SCCs) and shrink SCCs of the control-flow graph. See the source code.
- Alias Check: Traversal the control-flow graph and perform alias analysis. See the source code
Reference
The feature is based on our SafeDrop paper, which was published in TOSEM.
@article{cui2023safedrop,
  title={SafeDrop: Detecting memory deallocation bugs of rust programs via static data-flow analysis},
  author={Mohan Cui, Chengjun Chen, Hui Xu, and Yangfan Zhou},
  journal={ACM Transactions on Software Engineering and Methodology},
  volume={32},
  number={4},
  pages={1--21},
  year={2023},
  publisher={ACM New York, NY, USA}
}
Chapter 5.2. API-Dependency Graph
Overview
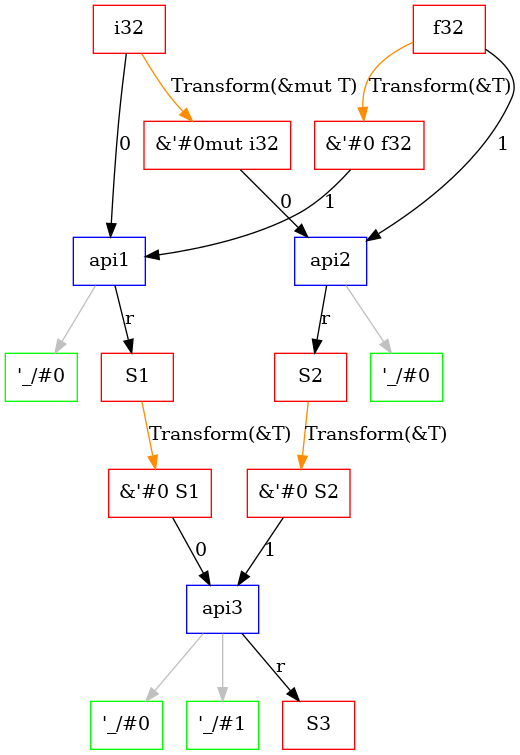
The API Dependency Graph is a directed graph structure that models dependencies among APIs, types, and generic parameters by traversing the APIs within a Rust library or crate. It contains three types of nodes: API, type and generic parameter. And it contains four types of edges : Arg(usize, recording the location in API parameter), Ret, Generic and Transform(TransformKind, recording the relation between types, such as T and &T, &mut T). Now this module is still under development and generic is not supported.
Use the following example to demonstrate this graph structure.
#![allow(unused)]
fn main() {
pub struct S1 {
    pub a: i32,
    pub b: f32,
}

pub struct S2 {
    pub a: i32,
    pub b: f32,
}

pub struct S3 {
    pub a: i32,
    pub b: f32,
}

pub fn api1(arg1: i32, arg2: &f32) -> S1 {
    S1 { a: arg1, b: *arg2 }
}
pub fn api2(arg1: &mut i32, arg2: f32) -> S2{
    S2 { a: *arg1, b: arg2 }
}

pub fn api3(arg1: &S1, arg2: &S2) -> S3{
    S3 { a: arg1.a, b: arg2.b }
}
}
By scanning the code above, we generate an API Dependency Graph like this:
Quick Usage Guide
If your project doesn't have a rust-toolchain.toml, you need to create such a file contains the following content:
[toolchain]
# The default version of the rustc compiler
channel = "nightly-2024-10-12"
components = ["rustc-dev", "rust-src", "llvm-tools-preview"]
We use this feature for generating fuzz targets about library APIs. You can use this feature with the following command(Make sure you are in a cargo project):
cargo rapx -testgen
This command will analyse your project and gengerate a .dot file in the current directory, which contains the API dependency graph information, and also generate a new project in the parent directory. The new project is a fuzz target that contains APIs in your project.You can visualize this graph by using one of the following commands.
dot -Tsvg your_crate_name.dot -o api_graph.svg
dot -Tpng your_crate_name.dot -o api_graph.png
To utilize the analysis results, you can use the module as follows:
#![allow(unused)]
fn main() {
use analysis::core::api_dep; // Import the module
let api_graph = api_dep::ApiDep::new(tcx).start(true) // true: collect only pub APIs; false: collect all APIs
}
The above codes can generate an API dependency graph based on your crate.
Graph APIs
The ApiDepGraph struct provides several APIs for interacting with the dependency graph. Below are the key methods. Before using these APIs, you need to import relevent module:
#![allow(unused)]
fn main() {
use analysis::core::api_dep::graph; // Import the module
}
statistics
Returns statistics about the graph, including counts of API nodes, type nodes, generic parameter nodes, and edges.
#![allow(unused)]
fn main() {
// Here is the definition of Statistics
pub struct Statistics {
    pub api_count: usize,
    pub type_count: usize,
    pub generic_param_count: usize,
    pub edge_cnt: usize,
}
pub fn statistics(&self) -> Statistics
}
inner_graph
Returns reference of the graph data.
#![allow(unused)]
fn main() {
pub fn inner_graph(&self) -> &InnerGraph<'tcx> // InnerGraph is Graph<DepNode<'tcx>, DepEdge>
}
provider_tys
Returns a list of types that can be transformed into the ty type.
#![allow(unused)]
fn main() {
pub fn provider_tys(&self, ty: Ty<'tcx>) -> Vec<Ty<'tcx>>
}
all_transform_for
Returns all transformation kinds applicable to the specified type.
#![allow(unused)]
fn main() {
pub fn all_transform_for(&self, ty: Ty<'tcx>) -> Vec<TransformKind>
}
get_node
Retrieves or creates a node index for a given DepNode. If node doesn't exist in graph, it will add this node into the graph and return it's NodeIndex.
#![allow(unused)]
fn main() {
pub fn get_node(&mut self, node: DepNode<'tcx>) -> NodeIndex
}
get_index_by_node
Given a DepNode, returns Option<Nodeindex>, cause it may not exist in the graph
#![allow(unused)]
fn main() {
pub fn get_index_by_node(&self, node: DepNode<'tcx>) -> Option<NodeIndex>
}
The feature is based on our RuMono paper, which was published in TOSEM.
@article{zhangrumono,
  title={RuMono: Fuzz Driver Synthesis for Rust Generic APIs},
  author={Zhang, Yehong and Wu, Jun and Xu, Hui},
  journal={ACM Transactions on Software Engineering and Methodology},
  publisher={ACM New York, NY}
}
Chapter 5.3. Call Graph Analysis
Overview
A call graph represents calling relationships between subroutines in a computer program. Each node represents a procedure and each edge (f,g) indicates the caller and callee relationship between f and g.
In our program, we provide the feature to generate static call graphs and store the result in a graph data structure implemented with adjacent list.
Quick Start
You can use the feature with the following command:
cargo rapx -callgraph
Graph APIs
To utilize the analysis results as you want, you can use our module as follows:
#![allow(unused)]
fn main() {
use analysis::core::call_graph::Callgraph;  // import module
let callgraph = Callgraph::new(tcx);    // create a callgraph object
callgraph.start();  // do the analysis
}
get_callee_def_path
#![allow(unused)]
fn main() {
pub fun get_callee_def_path(&self, def_path: String) -> Option<HashSet<String>>{
    ...
}
}
You can get all callees define path returned in a hash set with the caller define path.
Generating Call Graphs
Working with MIR (Mid-level Intermediate Representation)
MIR is Rust's intermediate representation used during compilation. It simplifies control flow by breaking down functions into a series of basic blocks, making it easier to analyze.
Our program make good use of this handy tool to help generate call graphs. We analyze what specific kind the current basic block belongs to, which represents ways of existing from a basic block.
#![allow(unused)]
fn main() {
pub struct Body<'tcx> {
    pub basic_blocks: BasicBlocks<'tcx>,
    ..
}

}
As basic_blocks exist in the struct Body, we should get Body first. There are some functions to help us with this:
- optimized_mir
- mir_for_ctfe ("stfe" stands for "Compile Time Function Evaluation")
In the case of DefKind::Const and DefKind::static, mir_for_ctfe is necessary, since rust prevents us from applying optimization to const or static ones.
Inside the BasicBlockData we can get Terminator.
#![allow(unused)]
fn main() {
pub enum TerminatorKind<'tcx> {
    Call {
        func: Operand<'tcx>,
        ..
    },
    ..
}
}
Our target is to get the Call in the enum TerminatorKind. Therefore we can use the resolve function to get define id of callee functions.
With define id (i.e. def_id), it is easy to apply it to def_path_str method to get define path and construct our call graphs.
Case Study: Dynamic Trait Analysis
It is nontrivial to analyze a program applying dynamic trait. Since we have to do our analysis statically, we guarantee the analysis sound and safe. In the case of dynamic trait analysis, we give out the "maybe" answer, e.g.:
|RAP|INFO|: 8:main -> 7:(dyn trait) <* as Animal>::make_sound
Chapter 5.4. Data-flow Analysis
Data-flow analysis tracks value flow in the program including copy, move, ref, and other scenarios. With this module, users can easily have a whole picture of the value flow in any function and query whether there is value dependency between two mir local variables.
This module defines a graph data structure to store the data parsed from Rust mir. The graph nodes are indexed by Local which is defined by rustc. The edges between the nodes also define the data dependency relationship.
Dataflow Analysis Trait
#![allow(unused)]
fn main() {
pub trait DataFlowAnalysis: Analysis {
    // Required methods
    fn get_fn_dataflow(&self, def_id: DefId) -> Option<DataFlowGraph>;
    fn get_all_dataflow(&self) -> DataFlowGraphMap;
    fn has_flow_between(
        &self,
        def_id: DefId,
        local1: Local,
        local2: Local,
    ) -> bool;
    fn collect_equivalent_locals(
        &self,
        def_id: DefId,
        local: Local,
    ) -> HashSet<Local>;
    fn get_fn_arg2ret(&self, def_id: DefId) -> Arg2Ret;
    fn get_all_arg2ret(&self) -> Arg2RetMap;
}
}
Quick Usage Guide
Developers can test the feature using the following command:
cargo rapx -dataflow
To switch in debug mode and draw the graph with graphviz, execute the following command.
cargo rapx -dataflow=debug
To use the feature in your own application, refer the following code.
#![allow(unused)]
fn main() {
let mut dataflow_analysis = DataFlowAnalyzer::new(self.tcx, false);
dataflow_analysis.run();
let dataflow = dataflow_analysis.get_all_arg2ret();
rap_info!("{}", Arg2RetMapWrapper(dataflow));
}
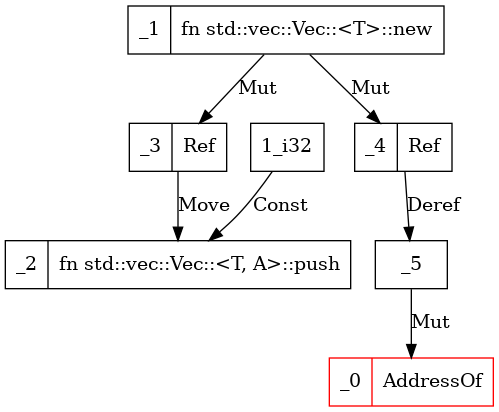
For example, we can apply the value flow analysis to the dangling_min case, and the result of function create_vec is as follows:
#![allow(unused)]
fn main() {
fn create_vec() -> *mut Vec<i32> {
    let mut v = Vec::new();
 //Fix: let mut v = Box::new(Vec::new());
    v.push(1);
    &mut v as *mut Vec<i32>
 //Fix: Box::into_raw(v)
}
}
To utilize the analysis results in other analytical features, developers can use RAPx as follows:
#![allow(unused)]
fn main() {
use analysis::core::dataflow::Dataflow; // import the module
let dataflow = Dataflow::new(tcx); // create a dataflow object
dataflow.build_graphs(); // parse all the functions in tcx and build corresponding graphs
}
Graph APIs
DFS
This function uses precedence traversal. The node operator and edge validator decide how far the traversal can reach with the help of return values. You can also modify outside variables captured by these two closures to record data during the DFS. traverse_all decides if a branch finds the target successfully, and whether the traversal will continue or not.
For example, if you need to instantly stop the traversal once finding a certain node, then set traverse_all to false.
If you want to traverse all the reachable nodes which are decided by the operator and validator, then set traverse_all to true.
#![allow(unused)]
fn main() {
pub fn dfs<F, G>(&self, now: Local, direction: Direction, node_operator: &mut F, edge_validator: &mut G, traverse_all: bool) -> DFSStatus
where
 F: FnMut(&Graph, Local) -> DFSStatus,
 G: FnMut(&Graph, EdgeIdx) -> DFSStatus,
}
is_connected
This function is built upon the DFS API. It tries to find idx_2 from idx_1, upside first then downside.
#![allow(unused)]
fn main() {
pub fn is_connected(&self, idx_1: Local, idx_2: Local) -> bool
}
Chapter 5.5. Owned Heap Analysis
The purpose of owned heap analysis is to determine whether a type holds a piece of memory on the heap.
OwnedHeapAnalysis Trait
#![allow(unused)]
fn main() {
pub trait OwnedHeapAnalysis: Analysis {
    // Required method
    fn get_all_items(&self) -> OHAResultMap;

    // Provided methods
    fn is_heapowner<'tcx>(
        hares: OHAResultMap,
        ty: Ty<'tcx>,
    ) -> Result<bool, &'static str> { ... }

    fn maybe_heapowner<'tcx>(
        hares: OHAResultMap,
        ty: Ty<'tcx>,
    ) -> Result<bool, &'static str> { ... }
}
}
We represent the result as a hashmap named OHAResult, where the key is DefId and the value contains the information of whether the type owns data on heap. Since a type could be a enumerate type, the value is represented as a Vec, indicating the heap information of each variant. Also, because it may contain type parameters or generic types, the heap information is a tuple containing the information of each type parameter.
#![allow(unused)]
fn main() {
pub type OHAResult = HashMap<DefId, Vec<(OwnedHeap, Vec<bool>)>>;
pub enum OwnedHeap {
    False = 0,
    True = 1,
    Unknown = 2,
}
}
Default Implementation
There are two general methods: either by examining the implementation of the Drop trait for the type, for the type or by checking the presence of a PhantomData marker. The analysis approach implemented in RAPx is based on [PhantomData].
We define a data structure as a heap unit if it contains a raw pointer to T and a PhantomData<T> field. It is the most fundamental unit that owns a piece of memory on the heap. Other data structures may internally contain heap units, referred to as heap owners or heap items.
For example, the following code employs the String data structure, which is based on Vec.
#![allow(unused)]
fn main() {
let _buf = String::from("hello, heap item");
}
When running RAPx with the -heap option, you will see the following result. The main result for String is (1, []), where 1 indicates that it is a heap item, and [] represents attributes for type parameters. Since the String data structure has no type parameters, [] is empty. The output also includes information about other types that String depends on.
Usage Guide
When running rapx with the -ownedheap option, you will see the following result. The main result for String is (1, []), where 1 indicates that it is a heap item, and [] represents the ownership of type parameters. Since the data structure has no type parameters, [] is empty. The output also includes information about other types that String depends on.
cargo rapx -ownedheap
    Checking heap_string...
21:20:05|RAP|INFO|: Start analysis with RAP.
21:20:05|RAP|INFO|: std::string::String (1, [])
21:20:05|RAP|INFO|: alloc::raw_vec::Cap (0, [])
21:20:05|RAP|INFO|: alloc::raw_vec::RawVec<T/#0, A/#1> (1, [0,1])
21:20:05|RAP|INFO|: std::ptr::Unique<T/#0> (1, [0])
21:20:05|RAP|INFO|: alloc::raw_vec::RawVecInner<A/#0> (1, [1])
21:20:05|RAP|INFO|: std::alloc::Global (0, [])
21:20:05|RAP|INFO|: std::ptr::NonNull<T/#0> (0, [0])
21:20:05|RAP|INFO|: std::vec::Vec<T/#0, A/#1> (1, [0,1])
21:20:05|RAP|INFO|: std::marker::PhantomData<T/#0> (0, [0])
RAPx provides a default implementation via the DefaultOwnedHeapAnalysis struct, developers can use the feature in their own analysis code as follows.
#![allow(unused)]
fn main() {
let mut heap_analysis = OwnedHeapAnalyzer::new(self.tcx);
heap_analysis.run();
let result = heap_analysis.get_all_items();
rap_info!("{}", OHAResultMapWrapper(result));
}
Analysis Method
There are two steps:
-
Type Parameter Analysis: If a data structure contains type parameters, the type parameter can be monomorphized into either a heap owner or a non-owner. If there are heap owners, whether the data structure ultimately owns heap memory depends on how the type parameter is used, i.e., as an owned value, a reference, or a raw pointer. Only ownership leads to an owned object. Therefore, we perform type parameter analysis to determine whether the data structure owns the type. This result is then used to assess whether a monomorphic type is a heap owner, significantly reducing the overhead of handling generic types.
-
Ownership Analysis: If a data structure contains a heap unit, it owns heap memory. Otherwise, if the data structure is not a direct heap owner, and it contains type parameters, we use the results from type parameter analysis and type assignment to determine whether its monomorphic version is a heap owner.
Next, we empoy the follow example to demonstrate the mechanism.
#![allow(unused)]
fn main() {
struct Proxy1<T> {
    _p: *mut T,
}
struct Proxy2<T> {
    _p: *mut T,
    _marker: PhantomData<T>,
}
struct Proxy3<'a, T> {
    _p: *mut T,
    _marker: PhantomData<&'a T>,
}
struct Proxy4<T> {
    _x: T,
}
struct Proxy5<T> {
    _x: Proxy2<T>,
}
}
This example contains five data structures:
Proxy1is not a heap unit because it does not containPhantomData<T>.Proxy2is a heap unit.Proxy3is not a heap unit because its PhantomData marker holds a reference rather than an owned value.Proxy4is not a direct heap owner, but it contains type parameters. Since it ownesT, we have to emply[1]to indicate the possibility of it being a heap owner, i.e., whenTitself is a heap owner.Proxy5is a heap owner becauseProxy2<T>is a heap unit. This type also contains the type parameterT, which is used inProxy2<T>. However, it does not ownTbecauseProxy2<T>does not ownT.
The analysis result is displayed as follows.
cargo rapx -heap
    Checking heap_proxy ...
11:42:05|RAP|INFO|: Proxy5<T/#0> (1, [0])
11:42:05|RAP|INFO|: Proxy4<T/#0> (0, [1])
11:42:05|RAP|INFO|: Proxy3<'a/#0, T/#1> (0, [0,0])
11:42:05|RAP|INFO|: Proxy2<T/#0> (1, [0])
11:42:05|RAP|INFO|: Proxy1<T/#0> (0, [0])
...
Chapter 5.6. Range Analysis in Rust
Range analysis is a type of static analysis used to track the range (interval) of possible values that a variable can take during the execution of a program. By maintaining an upper and lower bound for each variable, the analysis helps optimize code by narrowing the values that a program may handle. In Rust, range analysis is particularly important in verifying safety properties, such as ensuring that an array access is always within bounds or that certain calculations do not result in overflows.
Range Analysis Trait
#![allow(unused)]
fn main() {
pub trait RangeAnalysis<'tcx, T: IntervalArithmetic + ConstConvert + Debug>: Analysis {
    fn get_fn_range(&self, def_id: DefId) -> Option<RAResult<'tcx, T>>;
    fn get_fn_ranges_percall(
        &self,
        def_id: DefId,
    ) -> Option<Vec<RAResult<'tcx, T>>>;
    fn get_all_fn_ranges(&self) -> RAResultMap<'tcx, T>;
    fn get_all_fn_ranges_percall(&self) -> RAVecResultMap<'tcx, T>;
    fn get_fn_local_range(
        &self,
        def_id: DefId,
        local: Place<'tcx>,
    ) -> Option<Range<T>>;
    fn get_fn_path_constraints(
        &self,
        def_id: DefId,
    ) -> Option<PathConstraint<'tcx>>;
    fn get_all_path_constraints(&self) -> PathConstraintMap<'tcx>;
}
}
Quick Usage Guide
To test the feature via terminal command:
cargo rapx -range
or show the entire analysis process via terminal command:
RAP_LOG=trace cargo rapx -range
To use the feature in Rust code:
#![allow(unused)]
fn main() {
let mut range_analysis = RangeAnalyzer::<i128>::new(self.tcx, false);
range_analysis.run();
let path_constraint = range_analysis.get_all_path_constraints();
rap_info!("{}", PathConstraintMapWrapper(path_constraint));
let result = analyzer.get_all_fn_ranges();
}
Supported Integer Types For Ranges:
- i32, i64, i128
- u32, u64, u128
- usize
Default Implementation
RAPx provides a default implementation of RangeAnalysis trait in range_analysis.rs. The implementation is inspired by the following CGO paper.
- Raphael Ernani Rodrigues, Victor Hugo Sperle Campos, and Fernando Magno Quintao Pereira. "A fast and low-overhead technique to secure programs against integer overflows." In Proceedings of the 2013 IEEE/ACM international symposium on code generation and optimization (CGO), pp. 1-11. IEEE, 2013.
#![allow(unused)]
fn main() {
pub struct RangeAnalyzer<'tcx, T: IntervalArithmetic + ConstConvert + Debug> {
    pub tcx: TyCtxt<'tcx>,
    pub debug: bool,
    pub ssa_def_id: Option<DefId>,
    pub essa_def_id: Option<DefId>,
    pub final_vars: FxHashMap<DefId, HashMap<Local, Range<T>>>,
    pub ssa_locals_mapping: FxHashMap<DefId, HashMap<Local, HashSet<Local>>>,
}
}
Why SSA Form?
Before performing range analysis, the MIR (Mid-level Intermediate Representation) is first transformed into Static Single Assignment (SSA) form. SSA guarantees that each variable is assigned exactly once, and every use of a variable refers to a unique definition. This transformation simplifies the analysis in several ways:
-
It makes data flow explicit, allowing the analysis to accurately track how values propagate through the program.
-
It allows precise modeling of control flow joins using phi-like constructs.
-
It improves precision by allowing the interval of each version of a variable to be analyzed separately after each assignment.
Don’t worry about losing track of variables after SSA transformation: The
DefaultRangemaintains a mappingssa_locals_mapping, which is a HashMap from the original MIR Local variables to their corresponding SSA Locals. This ensures that even after SSA conversion, you can still query the intervals for the variables you care about using their original MIR identity. The SSA transformation is essential for sound and precise interval analysis and is a foundational preprocessing step in this system.
Range Analysis Features
Flow Sensitivity
Interval analysis in Rust can be flow-sensitive, meaning that it accounts for the different execution paths a program might take. This allows the analysis to track how intervals change as variables are assigned or modified during the execution flow, improving the precision of analysis.
Lattice-based Approach
In this approach, values of variables are represented in a lattice, where each element represents an interval. A lattice ensures that each combination of intervals has a defined result, and merging different paths of a program is done by taking the least upper bound (LUB) of intervals from each path.
For example, if a variable x can have an interval [0, 10] on one path and [5, 15] on another path, the merged interval would be [0, 15] because that represents the union of both possible value ranges.
Meet-over-all-paths (MOP) Approach
In the meet-over-all-paths (MOP) approach, the analysis is performed by considering every possible path through a program and merging the results into a final interval. This approach is path-sensitive but may be less scalable on large programs because it needs to account for all paths explicitly.
Precise Interprocedural Analysis
Although each callee function is analyzed once globally for performance,Every call site (i.e., function invocation) triggers a separate numeric evaluation using the actual arguments passed in.
This hybrid approach preserves analysis precision without sacrificing performance.
Case Study: Array Bound Checking
Consider the case where interval analysis can be used to check array bounds. Rust guarantees memory safety through strict bounds checking, but interval analysis can help eliminate redundant checks or prevent unsafe accesses during compile-time.
#![allow(unused)]
fn main() {
fn get_element(arr: &[i32], index: usize) -> Option<i32> {
    if index < arr.len() {
        Some(arr[index])
    } else {
        None
    }
}

}
Using interval analysis, the compiler can infer the interval for index and ensure that it remains within bounds ([0, arr.len())). If an interval of index is known to always be within this range, the compiler could potentially eliminate the bounds check, optimizing the code.
Chapter 6. RAP Applications
This section introduces several applications of RAPx, covering both security and performance use cases. For security, RAP currently supports the detection of dangling pointer and memory leak bugs, and it can be used to audit unsafe code. Please refer to the sub-chapters for more information.
Default Options for Rust Project Compilation
To analyze system software without std (e.g., Asterinas), try the following command:
cargo rapx -F -- --target x86_64-unknown-none
To analyze the Rust standard library, try the following command:
cargo rapx -F -- -Z build-std --target x86_64-unknown-linux-gnu
Chapter 6.1. Dangling Pointer Detection
Rust uses ownership-based resource management (OBRM) and automatically deallocates unused resources without a garbage collector. This approach can potentially lead to premature memory deallocation, resulting in use-after-free or double-free errors. A significant portion of these bugs is related to the unwinding path, making them difficult to detect through testing or dynamic analysis. For more details, please refer to the SafeDrop paper published in TOSEM.
PoC
Below is a toy example demonstrating a Rust program with a use-after-free bug. The Data object is automatically dropped once the program exits the inner block scope of main. Accessing ptr after this point triggers a use-after-free error. You can find several such PoC examples within the folder of RAPx/tests.
struct Data {
    value: Box<i32>,
}

impl Data {
    fn new(value: i32) -> Data {
        Data { value:Box::new(value) }
    }

    fn print_value(&self) {
        println!("Value: {}", self.value);
    }
}

fn main() {
    let ptr: *const Data;

    {
        let data = Data::new(42);
        ptr = &data as *const Data;
    } // data is automatically dropped here, leaving ptr dangling.

    unsafe {
        (*ptr).print_value(); // use-after-free.
    }
}
Usage
To detect such bugs, navigate to the project directory and execute the following command.
cargo rapx -uaf
RAPx outputs a warning message in yellow if bugs are detected. For example, when applying RAP to the previous PoC, the log message appears as follows:
21:49|RAP-FRONT|WARN|: Use after free detected in function "main"
21:49|RAP-FRONT|WARN|: Location: src/main.rs:27:9: 27:20 (#0)
21:49|RAP-FRONT|WARN|: Location: src/main.rs:27:9: 27:34 (#0)
Mechanism
There are two essential steps in detecting such bugs:
- Alias preparation We begin by running an alias model to identify the aliases among the arguments and return value of each function. This result is later used to streamline inter-procedural analysis. The current implementation is based on an mop-based alias analysis module.
- Bug detection We traverse each path of a target function, performing alias analysis at each program point along the way. During this process, we check for any incorrect use or return of dangling pointers.
The implementation can be found as a module named SafeDrop.
Reference
The feature is based on our SafeDrop paper, which was published in TOSEM.
@article{cui2023safedrop,
  title={SafeDrop: Detecting memory deallocation bugs of rust programs via static data-flow analysis},
  author={Mohan Cui, Chengjun Chen, Hui Xu, and Yangfan Zhou},
  journal={ACM Transactions on Software Engineering and Methodology},
  volume={32},
  number={4},
  pages={1--21},
  year={2023},
  publisher={ACM New York, NY, USA}
}
Chapter 6.2. Memory Leakage Detection
Rust employs a novel ownership-based resource management model to facilitate automated deallocation during compile time. However, sometimes developers may interventionally drives it into mannualy drop mode and which is prone to memory leak.
rCanary is a static model checker to detect leaks across the semi-automated boundary.
We support the detection of the following two types of issues:
- Orphan Object: An orphan object is the heap item wrapped by the smart pointer ManuallyDrop.
fn main() {
    let mut buf = Box::new("buffer");
    // heap item ’buf’ becomes an orphan object
    let ptr = Box::into_raw(buf);
    // leak by missing free operation on ’ptr’
    // unsafe { drop_in_place(ptr); }
}
- Proxy type: A proxy type is a compound type having at least one field that stores an orphan object.
struct Proxy<T> {
    ptr: * mut T,
}
impl<T> Drop for Proxy<T> {
    fn drop(&mut self) {
        // user should manually free the field ’ptr’
        // unsafe { drop_in_place(self.ptr); }
    }

    fn main() {
        let mut buf = Box::new("buffer");
        // heap item ’buf’ becomes an orphan object
        let ptr = &mut * ManuallyDrop::new(buf) as * mut _;
        let proxy = Proxy { ptr };
        // leak by missing free ’proxy.ptr’ in drop
    }
}
What's behind rCanary?
Canary is a component of RAPx, and the overall architecture is as shown in the following diagram:
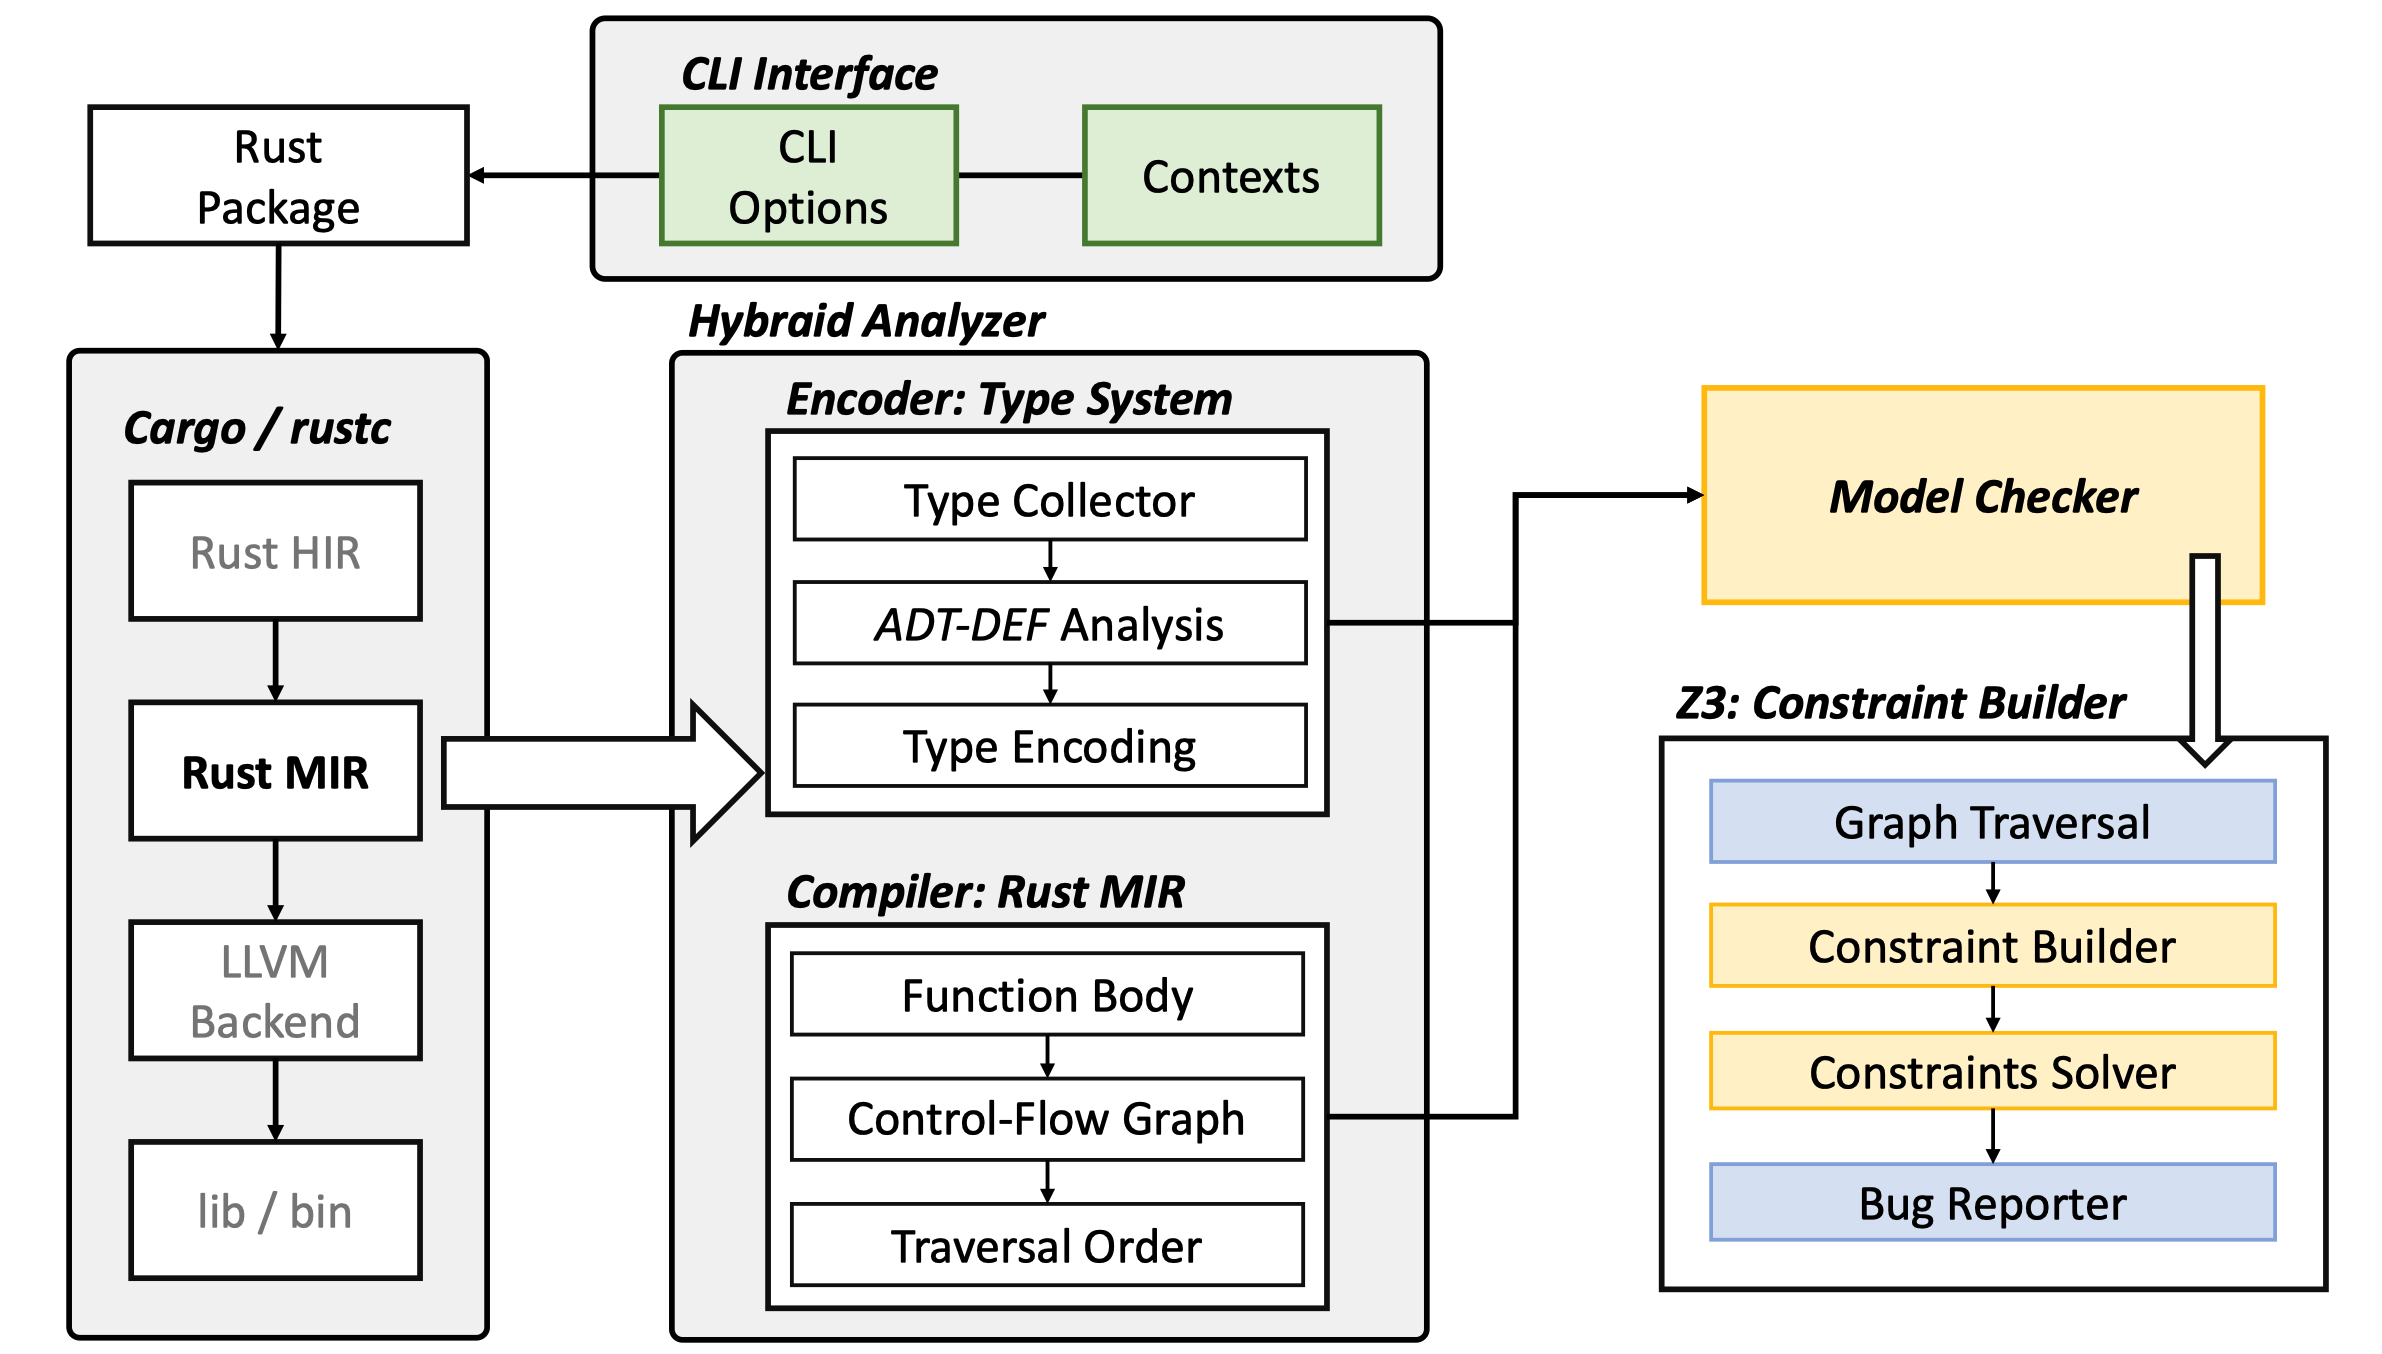
It can generate SMT-Lib2 format constraints for Rust MIR and is implemented as a Cargo component. We design an encoder to abstract data with heap allocation and formalize a refined leak-free memory model based on boolean satisfiability.
#![allow(unused)]
fn main() {
pub fn start_analyzer(tcx: TyCtxt, config: RapConfig) {
    let rcx_boxed = Box::new(RapGlobalCtxt::new(tcx, config));
    let rcx = Box::leak(rcx_boxed);

    let _rcanary: Option<rCanary> = if callback.is_rcanary_enabled() {
        let mut rcx = rCanary::new(tcx);
        rcx.start();
        Some(rcx)
    } else {
        None
    };
}

pub fn start(&mut self) {
    let rcx_boxed = Box::new(rCanary::new(self.tcx));
    let rcx = Box::leak(rcx_boxed);
    TypeAnalysis::new(rcx).start();
    FlowAnalysis::new(rcx).start();
}
}
The start_analyzer function defines all the analysis processes of rCanary, with two important steps being TypeAnalysis and FlowAnalysis, corresponding to the ADT-DEF Analysis, constraint construction, and constraint solving described in the paper.
Running rCanary
Invocation
Before using rCanary, please make sure that the Z3 solver is installed in your operating system.
If not, run: brew install z3 or apt-get install z3, with a minimum version of 4.10 for Z3.
Running rCanary within RAPx is very simple, just enter the sysroot (root directory) of a Cargo program and run:
cargo rapx -mleak
Note: Analysis will be terminated if the directory or toolchain version is not
nightly-2024-06-30.
Additional Configure Arguments
rCanary also provides several optional environment variables output sections for intermediate results.
ADTRES- Print the results of type analysis, including the type definition and the analysis tuple.
Z3GOAL- Emit the Z3 formula of the given function, it is in the SMT-Lib2 format.
ICXSLICE- Set Verbose to print the middle metadata for rCANARY debug.
Note: These parameters may change due to version migration.
Running Results on PoC
For the test case, we chose the same PoC as in the paper to facilitate user understanding and testing.
fn main() {
    let mut buf = Box::new("buffer");
    // heap item ’buf’ becomes an orphan object
    let ptr = Box::into_raw(buf);
    // leak by missing free operation on ’ptr’
    // unsafe { drop_in_place(ptr); }
}
Running cargo rapx -mleak:
22:10:39|RAP|WARN|: Memory Leak detected in function main
warning: Memory Leak detected.
--> src/main.rs:3:16
  |
1 | fn main() {
2 |     let buf = Box::new("buffer");
3 |     let _ptr = Box::into_raw(buf);
  |                ------------------ Memory Leak Candidates.
4 | }
ADTRES
#![allow(unused)]
fn main() {
core::fmt::rt::Placeholder [(Unowned, [])]
std::ptr::Unique<T/#0> [(Owned, [false])]
std::convert::Infallible []
std::marker::PhantomData<T/#0> [(Unowned, [false])]
std::boxed::Box<T/#0, A/#1> [(Owned, [false, true])]
std::alloc::Global [(Unowned, [])]
std::alloc::Layout [(Unowned, [])]
std::mem::ManuallyDrop<T/#0> [(Unowned, [true])]
std::result::Result<T/#0, E/#1> [(Unowned, [true, false]), (Unowned, [false, true])]
std::alloc::AllocError [(Unowned, [])]
core::fmt::rt::ArgumentType<'a/#0> [(Unowned, [false]), (Unowned, [false])]
core::fmt::rt::Count [(Unowned, []), (Unowned, []), (Unowned, [])]
std::fmt::Arguments<'a/#0> [(Unowned, [false])]
std::ptr::NonNull<T/#0> [(Unowned, [false])]
std::ptr::Alignment [(Unowned, [])]
core::fmt::rt::Alignment [(Unowned, []), (Unowned, []), (Unowned, []), (Unowned, [])]
std::ops::ControlFlow<B/#0, C/#1> [(Unowned, [false, true]), (Unowned, [true, false])]
core::fmt::rt::Argument<'a/#0> [(Unowned, [false])]
std::option::Option<T/#0> [(Unowned, [false]), (Unowned, [true])]
std::ptr::alignment::AlignmentEnum [(Unowned, []), (Unowned, []), (Unowned, []), (Unowned, []), (Unowned, []), (Unowned, []), (Unowned, []), (Unowned, []), (Unowned, []), (Unowned, []), (Unowned, []), (Unowned, []), (Unowned, []), (Unowned, []), (Unowned, []), (Unowned, []), (Unowned, []), (Unowned, []), (Unowned, []), (Unowned, []), (Unowned, []), (Unowned, []), (Unowned, []), (Unowned, []), (Unowned, []), (Unowned, []), (Unowned, []), (Unowned, []), (Unowned, []), (Unowned, []), (Unowned, []), (Unowned, []), (Unowned, []), (Unowned, []), (Unowned, []), (Unowned, []), (Unowned, []), (Unowned, []), (Unowned, []), (Unowned, []), (Unowned, []), (Unowned, []), (Unowned, []), (Unowned, []), (Unowned, []), (Unowned, []), (Unowned, []), (Unowned, []), (Unowned, []), (Unowned, []), (Unowned, []), (Unowned, []), (Unowned, []), (Unowned, []), (Unowned, []), (Unowned, []), (Unowned, []), (Unowned, []), (Unowned, []), (Unowned, []), (Unowned, []), (Unowned, []), (Unowned, []), (Unowned, [])]
}
Z3GOAL
#![allow(unused)]
fn main() {
(goal
  |CONSTRAINTS: T 0|
  (= |0_0_1_ctor_fn| #b01)
  |CONSTRAINTS: S 1 2|
  (= |1_2_1| #b00)
  (= |1_2_3_ctor_asgn| |0_0_1_ctor_fn|)
  |CONSTRAINTS: T 1|
  (= |1_0_3_drop_all| (bvand |1_2_3_ctor_asgn| #b10))
  (= |1_0_2_ctor_fn| #b1)
  |CONSTRAINTS: S 2 1|
  |CONSTRAINTS: T 2|
  (= |2_0_1_return| |1_2_1|)
  (= |2_0_1_return| #b00)
  (= |2_0_2_return| |1_0_2_ctor_fn|)
  (= |2_0_2_return| #b0)
  (= |2_0_3_return| |1_0_3_drop_all|)
  (= |2_0_3_return| #b00))
}
ICXSLICE
#![allow(unused)]
fn main() {
IcxSlice in Terminator: 0: _1 = std::boxed::Box::<&str>::new(const "buffer") -> [return: bb1, unwind continue]
IcxSliceForBlock
     [Taint { set: {} }, Taint { set: {} }, Taint { set: {} }, Taint { set: {} }]
     [0, 2, 0, 0]
     [Declared, Init(|0_0_1_ctor_fn|), Declared, Declared]
     [[], [Owned, Unowned], [], []]
     [TyWithIndex(None), TyWithIndex(Some((2, std::boxed::Box<&'{erased} str, std::alloc::Global>, None, true))), TyWithIndex(None), TyWithIndex(None)]

IcxSlice in Assign: 1 2: Assign((_3, move _1))
IcxSliceForBlock
     [Taint { set: {} }, Taint { set: {} }, Taint { set: {} }, Taint { set: {} }]
     [0, 2, 0, 2]
     [Declared, Init(|1_2_1|), Declared, Init(|1_2_3_ctor_asgn|)]
     [[], [Owned, Unowned], [], [Owned, Unowned]]
     [TyWithIndex(None), TyWithIndex(Some((2, std::boxed::Box<&'{erased} str, std::alloc::Global>, None, true))), TyWithIndex(None), TyWithIndex(Some((2, std::boxed::Box<&'{erased} str, std::alloc::Global>, None, true)))]

IcxSlice in Terminator: 1: _2 = std::boxed::Box::<&str>::into_raw(move _3) -> [return: bb2, unwind: bb3]
IcxSliceForBlock
     [Taint { set: {} }, Taint { set: {} }, Taint { set: {TyWithIndex(Some((2, std::boxed::Box<&'{erased} str, std::alloc::Global>, None, true)))} }, Taint { set: {} }]
     [0, 2, 1, 2]
     [Declared, Init(|1_2_1|), Init(|1_0_2_ctor_fn|), Init(|1_0_3_drop_all|)]
     [[], [Owned, Unowned], [Unowned], [Owned, Unowned]]
     [TyWithIndex(None), TyWithIndex(Some((2, std::boxed::Box<&'{erased} str, std::alloc::Global>, None, true))), TyWithIndex(Some((1, *mut &'{erased} str, None, true))), TyWithIndex(Some((2, std::boxed::Box<&'{erased} str, std::alloc::Global>, None, true)))]

IcxSlice in Assign: 2 1: Assign((_0, const ()))
IcxSliceForBlock
     [Taint { set: {} }, Taint { set: {} }, Taint { set: {TyWithIndex(Some((2, std::boxed::Box<&'{erased} str, std::alloc::Global>, None, true)))} }, Taint { set: {} }]
     [0, 2, 1, 2]
     [Declared, Init(|1_2_1|), Init(|1_0_2_ctor_fn|), Init(|1_0_3_drop_all|)]
     [[], [Owned, Unowned], [Unowned], [Owned, Unowned]]
     [TyWithIndex(None), TyWithIndex(Some((2, std::boxed::Box<&'{erased} str, std::alloc::Global>, None, true))), TyWithIndex(Some((1, *mut &'{erased} str, None, true))), TyWithIndex(Some((2, std::boxed::Box<&'{erased} str, std::alloc::Global>, None, true)))]

IcxSlice in Terminator: 2: return
IcxSliceForBlock
[Taint { set: {} }, Taint { set: {} }, Taint { set: {TyWithIndex(Some((2, std::boxed::Box<&'{erased} str, std::alloc::Global>, None, true)))} }, Taint { set: {} }]
[0, 2, 1, 2]
[Declared, Init(|1_2_1|), Init(|1_0_2_ctor_fn|), Init(|1_0_3_drop_all|)]
[[], [Owned, Unowned], [Unowned], [Owned, Unowned]]
[TyWithIndex(None), TyWithIndex(Some((2, std::boxed::Box<&'{erased} str, std::alloc::Global>, None, true))), TyWithIndex(Some((1, *mut &'{erased} str, None, true))), TyWithIndex(Some((2, std::boxed::Box<&'{erased} str, std::alloc::Global>, None, true)))]
}
Reference
The feature is based on our rCanary work, which was published in TSE
@article{cui2024rcanary,
  title={rCanary: rCanary: Detecting memory leaks across semi-automated memory management boundary in Rust},
  author={Mohan Cui, Hongliang Tian, Hui Xu, and Yangfan Zhou},
  journal={IEEE Transactions on Software Engineering},
  year={2024},
}
Chapter 6.3. Performance Bug Detection
This module is designed to identify performance bottlenecks and inefficiencies within a program by employing static analysis methods. After the analysis, rap will report potential code inefficiencies and their positions.
This module is still under development.
Performance Bugs Supported
Bounds checking
An example of unnecessary bounds checking is as follows.
#![allow(unused)]
fn main() {
fn foo(mut a: Vec<i32>) {
    for i in 0..a.len() {
        a[i] = a[i] + 1;
    }
}
}
Here RAPx will suggest replacing the safe index API with unsafe APIs.
Memory cloning
RAPx will report a warning where a cloned object is used as a immutable value. Developers need to manually check whether to remove the cloning or not.
An example is as follows. Here the cloning is unnecessary because we can use borrowings as keys of the HashSet.
#![allow(unused)]
fn main() {
fn foo(a: &Vec<String>) {
    let mut b = HashSet::new();
    for i in a {
        let c = i.clone();
        b.insert(c);
    }
}
}
Data collections
Sometimes there exists a better data collection with higher performance. RAPx will detect the pattern and give suggestions.
An example where HashSet is better than Vec is shown as follows.
#![allow(unused)]
fn main() {
fn foo(a: Vec<i32>, b: Vec<i32>) {
    for i in b.iter() {
        if a.contains(i) {}
    }
}
}
Usage
To detect such bugs, navigate to the project directory and execute the following command.
cargo rapx -opt
Chapter 6.4. Unsafe Code Audit and Verification
1 Overview
Unsafe Code enables necessary low-level operations, but it bypasses Rust's compiler guarantees, potentially introducing undefined behavior (UB) if used incorrectly.
This module employs call graph segmentation and dataflow analysis for systematic code auditing, and utilizes abstract interpretation and contract-based verification to check safety properties. Specifically, it operates on three core pillars:
(1) Audit unit generation: Segmenting Rust code into independent units to set analysis boundaries for verification and inference.
(2) Safety property verification: Verifying if the safety properties required by unsafe APIs are satisfied.
(3) Safety property inference: Inferring the safety properties of unsafe APIs based on the audit unit.
Core Assumptions
Our approach rests on two foundational assumptions:
- P1: All undefined behavior originates from unsafe code blocks
- P2: A function is sound if all execution paths satisfy safety properties of unsafe operations they interact with.
2 Audit Unit Generation
2.1 What's the Audit Unit
Audit unit is the foundational abstraction which defines analysis boundaries for verification and inference.
2.2 Why Audit Unit Is Needed
Just as our assumption P1 states, undefined behavior (UB) only originates from unsafe code blocks. Therefore, the detection of UB essentially involves the management of unsafe code.
Given a Rust crate, there are three typical scenarios to be considered for unsafe code handling:
-
Original unsafe code annotation: (i) Unsafe code in a Rust crate without any other internal unsafe code; (ii) An unsafe API originating from another library outside the crate.
-
Safe property delegation: An unsafe API which exposes the safety requirements of internal unsafe code.
-
Safety encapsulation: A safe API which fully enforces all necessary safety properties of internal unsafe code.
These scenarios inherently have boundaries, where the unsafety propagation can be contained or observed. Therefore, to effectively isolate, analyze, and verify the safety of unsafe code, we establish audit units to enable focused and manageable safety audits.
2.3 How to Construct and Use Audit Unit
2.3.1 Audit Unit Construction
The audit unit combines the traditional call graph with unsafe and dataflow information to capture the use and propagation of unsafe code across the project. It is constructed as follows:
(1) Identify all functions and methods with unsafe markers. Add call and object-flow edges to form unsafety propagation graphs (UPG).
(2) Divide UPG according to the structural patterns of basic units (More detailed information can be obtained from our paper).
(3) Merge basic units when multiple unsafe callees share a common caller or when a dynamic-method caller has multiple constructors to construct audit units.
2.3.2 Audit Unit Usage
The audit unit constitutes the foundational abstraction, defining analysis boundaries for verification and inference. It integrates with the tag-std - a comprehensive taxonomy of safety properties extracted from Rust's standard library - to establish a unified analytical foundation.
Usage Summary: Audit Unit → Set analysis scope → tag-std (safety rules) → Contracts verified or UB detected.
2.3.3 Poc of Audit Unit
Here is a simple structure along with its corresponding constructor and methods.
#![allow(unused)]
fn main() {
/// Record secret buffer with its size.
struct SecretRegion {
    buffer: Vec<u32>,
    len: usize,
}

impl SecretRegion {
    pub unsafe fn from(v: Vec<u32>, l: usize) -> Self {
        SecretRegion { buffer: v, len: l }
    }

    pub unsafe fn set_len(&mut self, l:usize) {
        self.len = l;
    }

    pub unsafe fn xor_secret_region(
        &self,
        ptr: *mut u32,
        offset: isize,
    ) -> u32 {
        let mut src_value = ptr.read();
        let secret_ptr = self.buffer.as_ptr();
        let secret_region_ptr = secret_ptr.offset(offset);
        let secret_value = secret_region_ptr.read();
        src_value ^= secret_value;
        src_value
    }
}

fn f() {
    let mut v = vec![0xDEADBEEF, 0xCAFEBABE, 0x12345678];
    let mut data = [0x11111111, 0x22222222, 0x33333333];
    let (p,l,_c) = v.into_raw_parts();
    let mut s = unsafe { SecretRegion::from(p, 0)};
    unsafe {
        s.set_len(l);
        s.xor_secret_region(data.as_mut_ptr(), 0);
    }
}
}
Figure 1a-1c shows the specific generation process of the audit units for the code. Here, we use required safety property (RS) and verified safety property (VS) to construct an audit formula to describe the satisfaction conditions of each audit unit. RS and VS are sets of safety tags from tag-std.
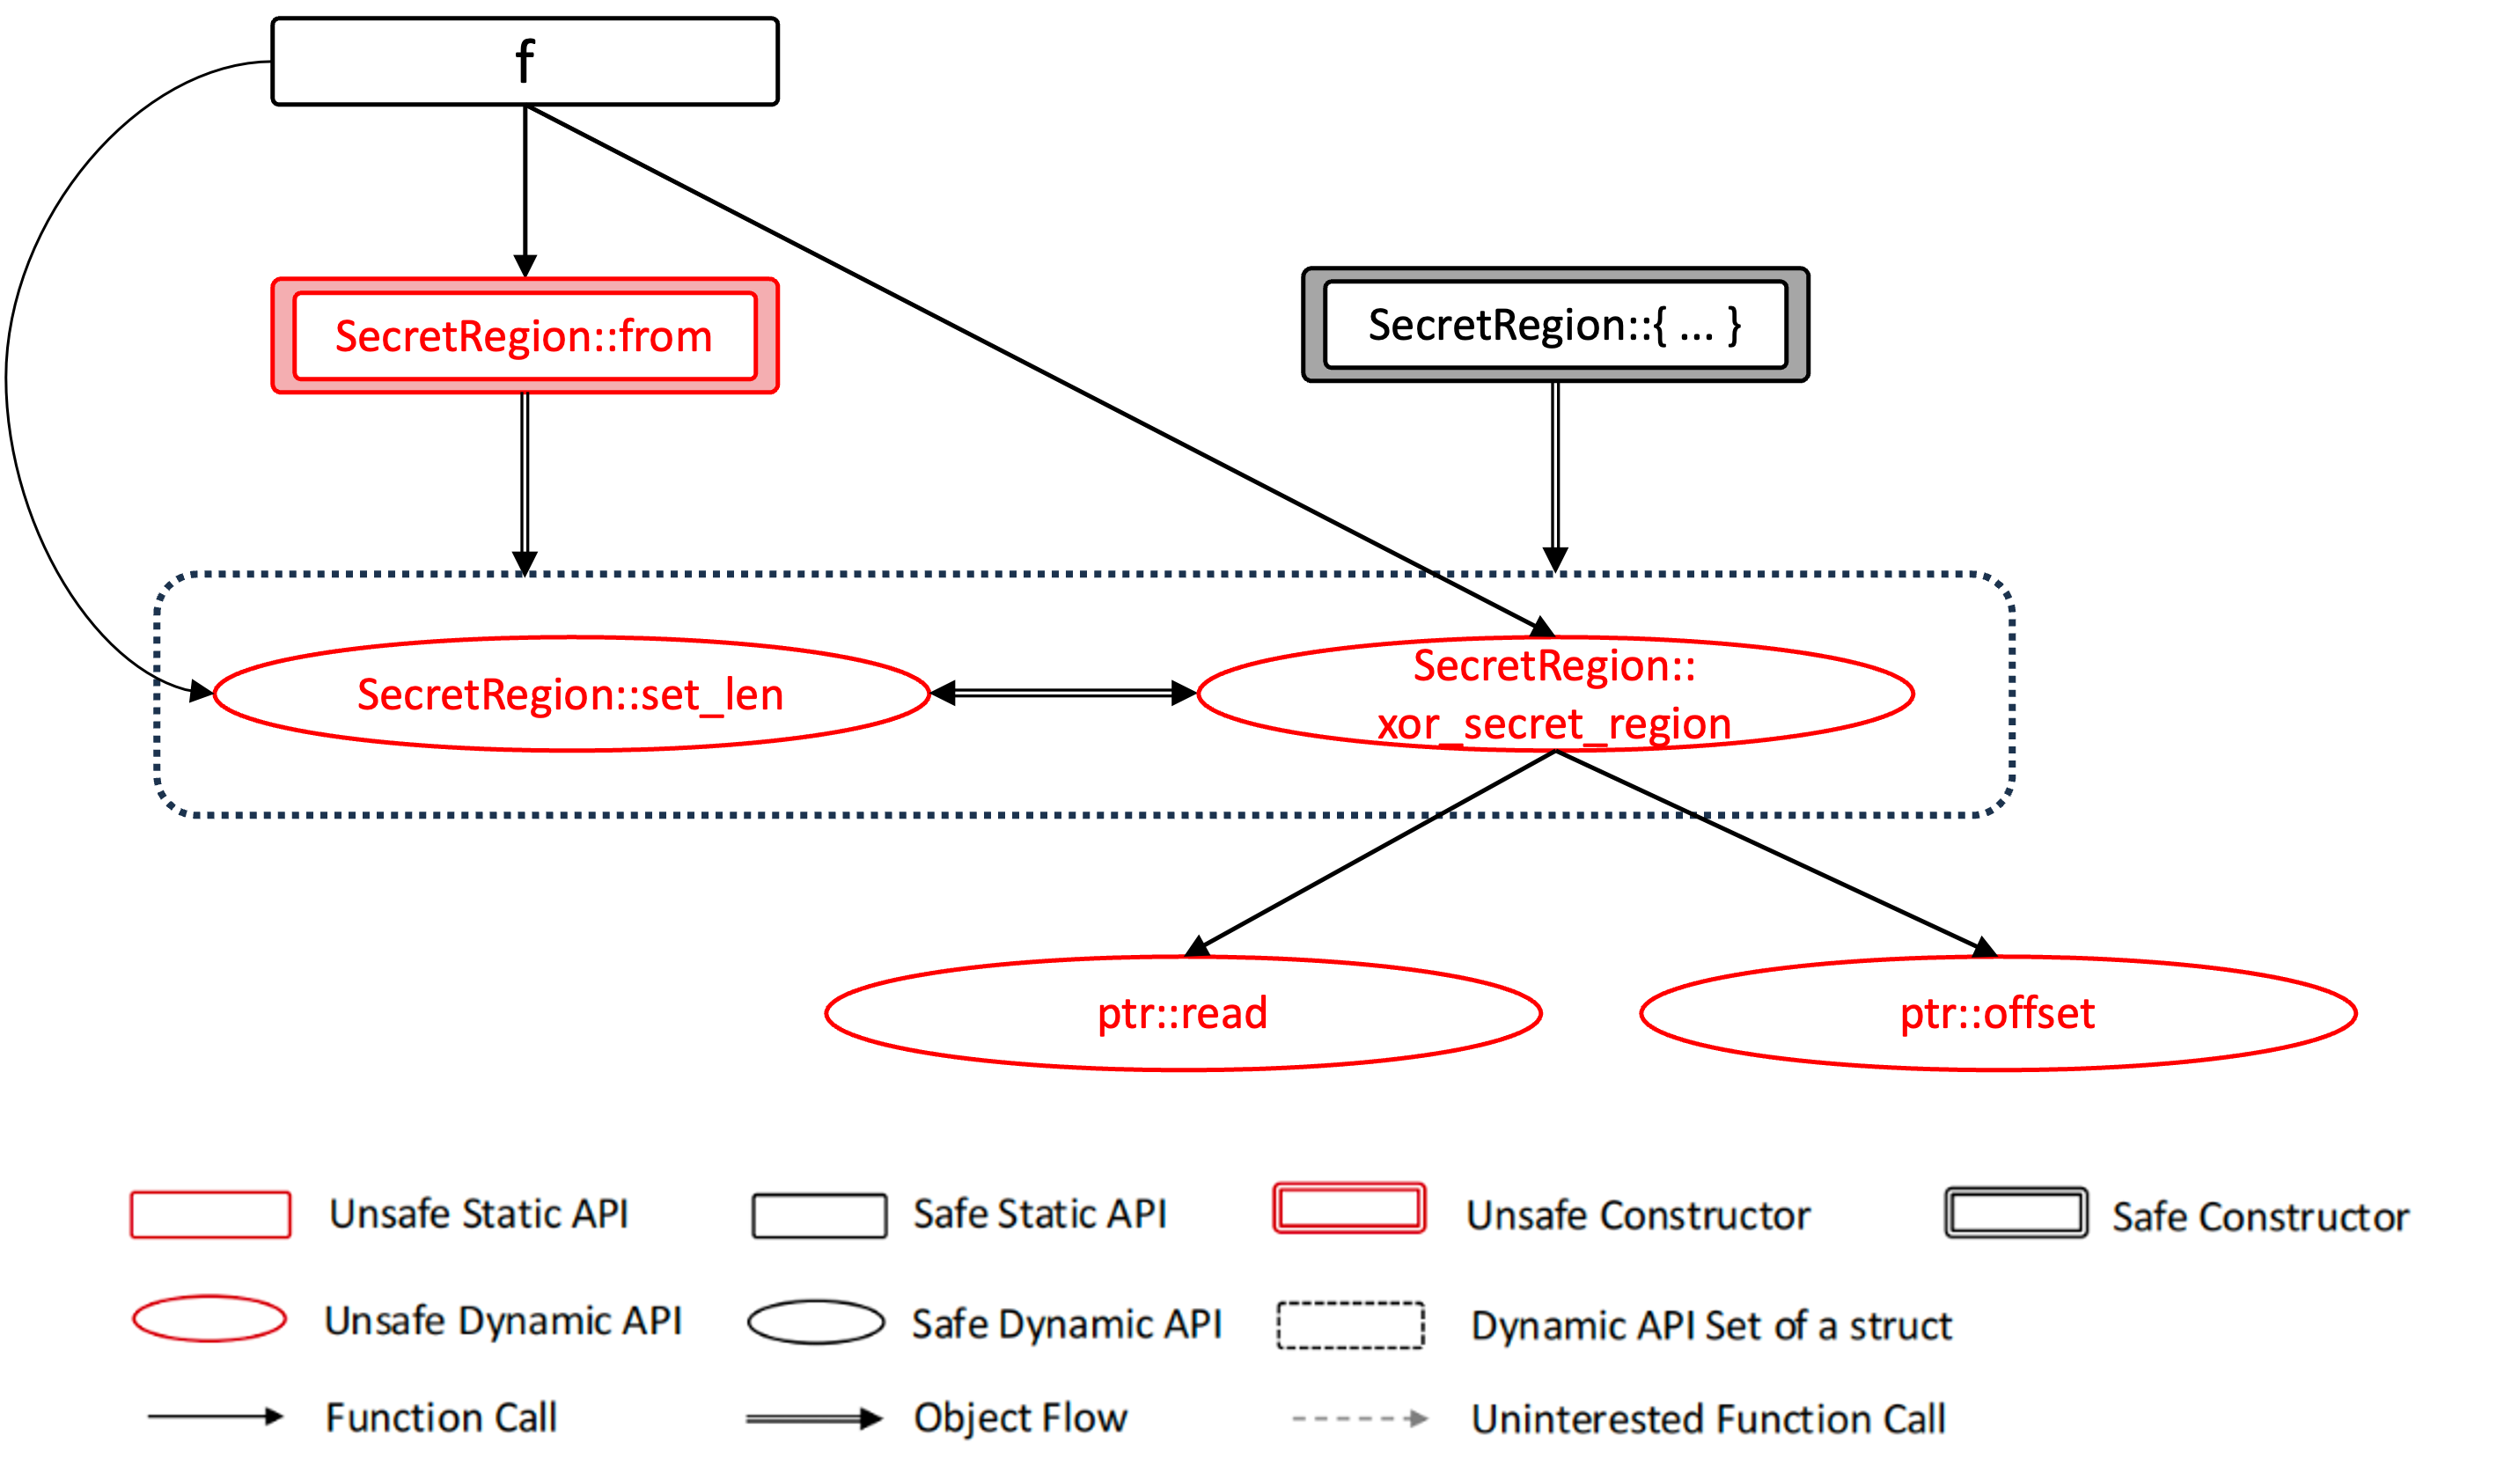
Fig-1a: Unsafety propagation graph. Function calls like f -> Vec::into_raw_parts are not considered in the UPG because they are all safe functions and do not involve any safety considerations.
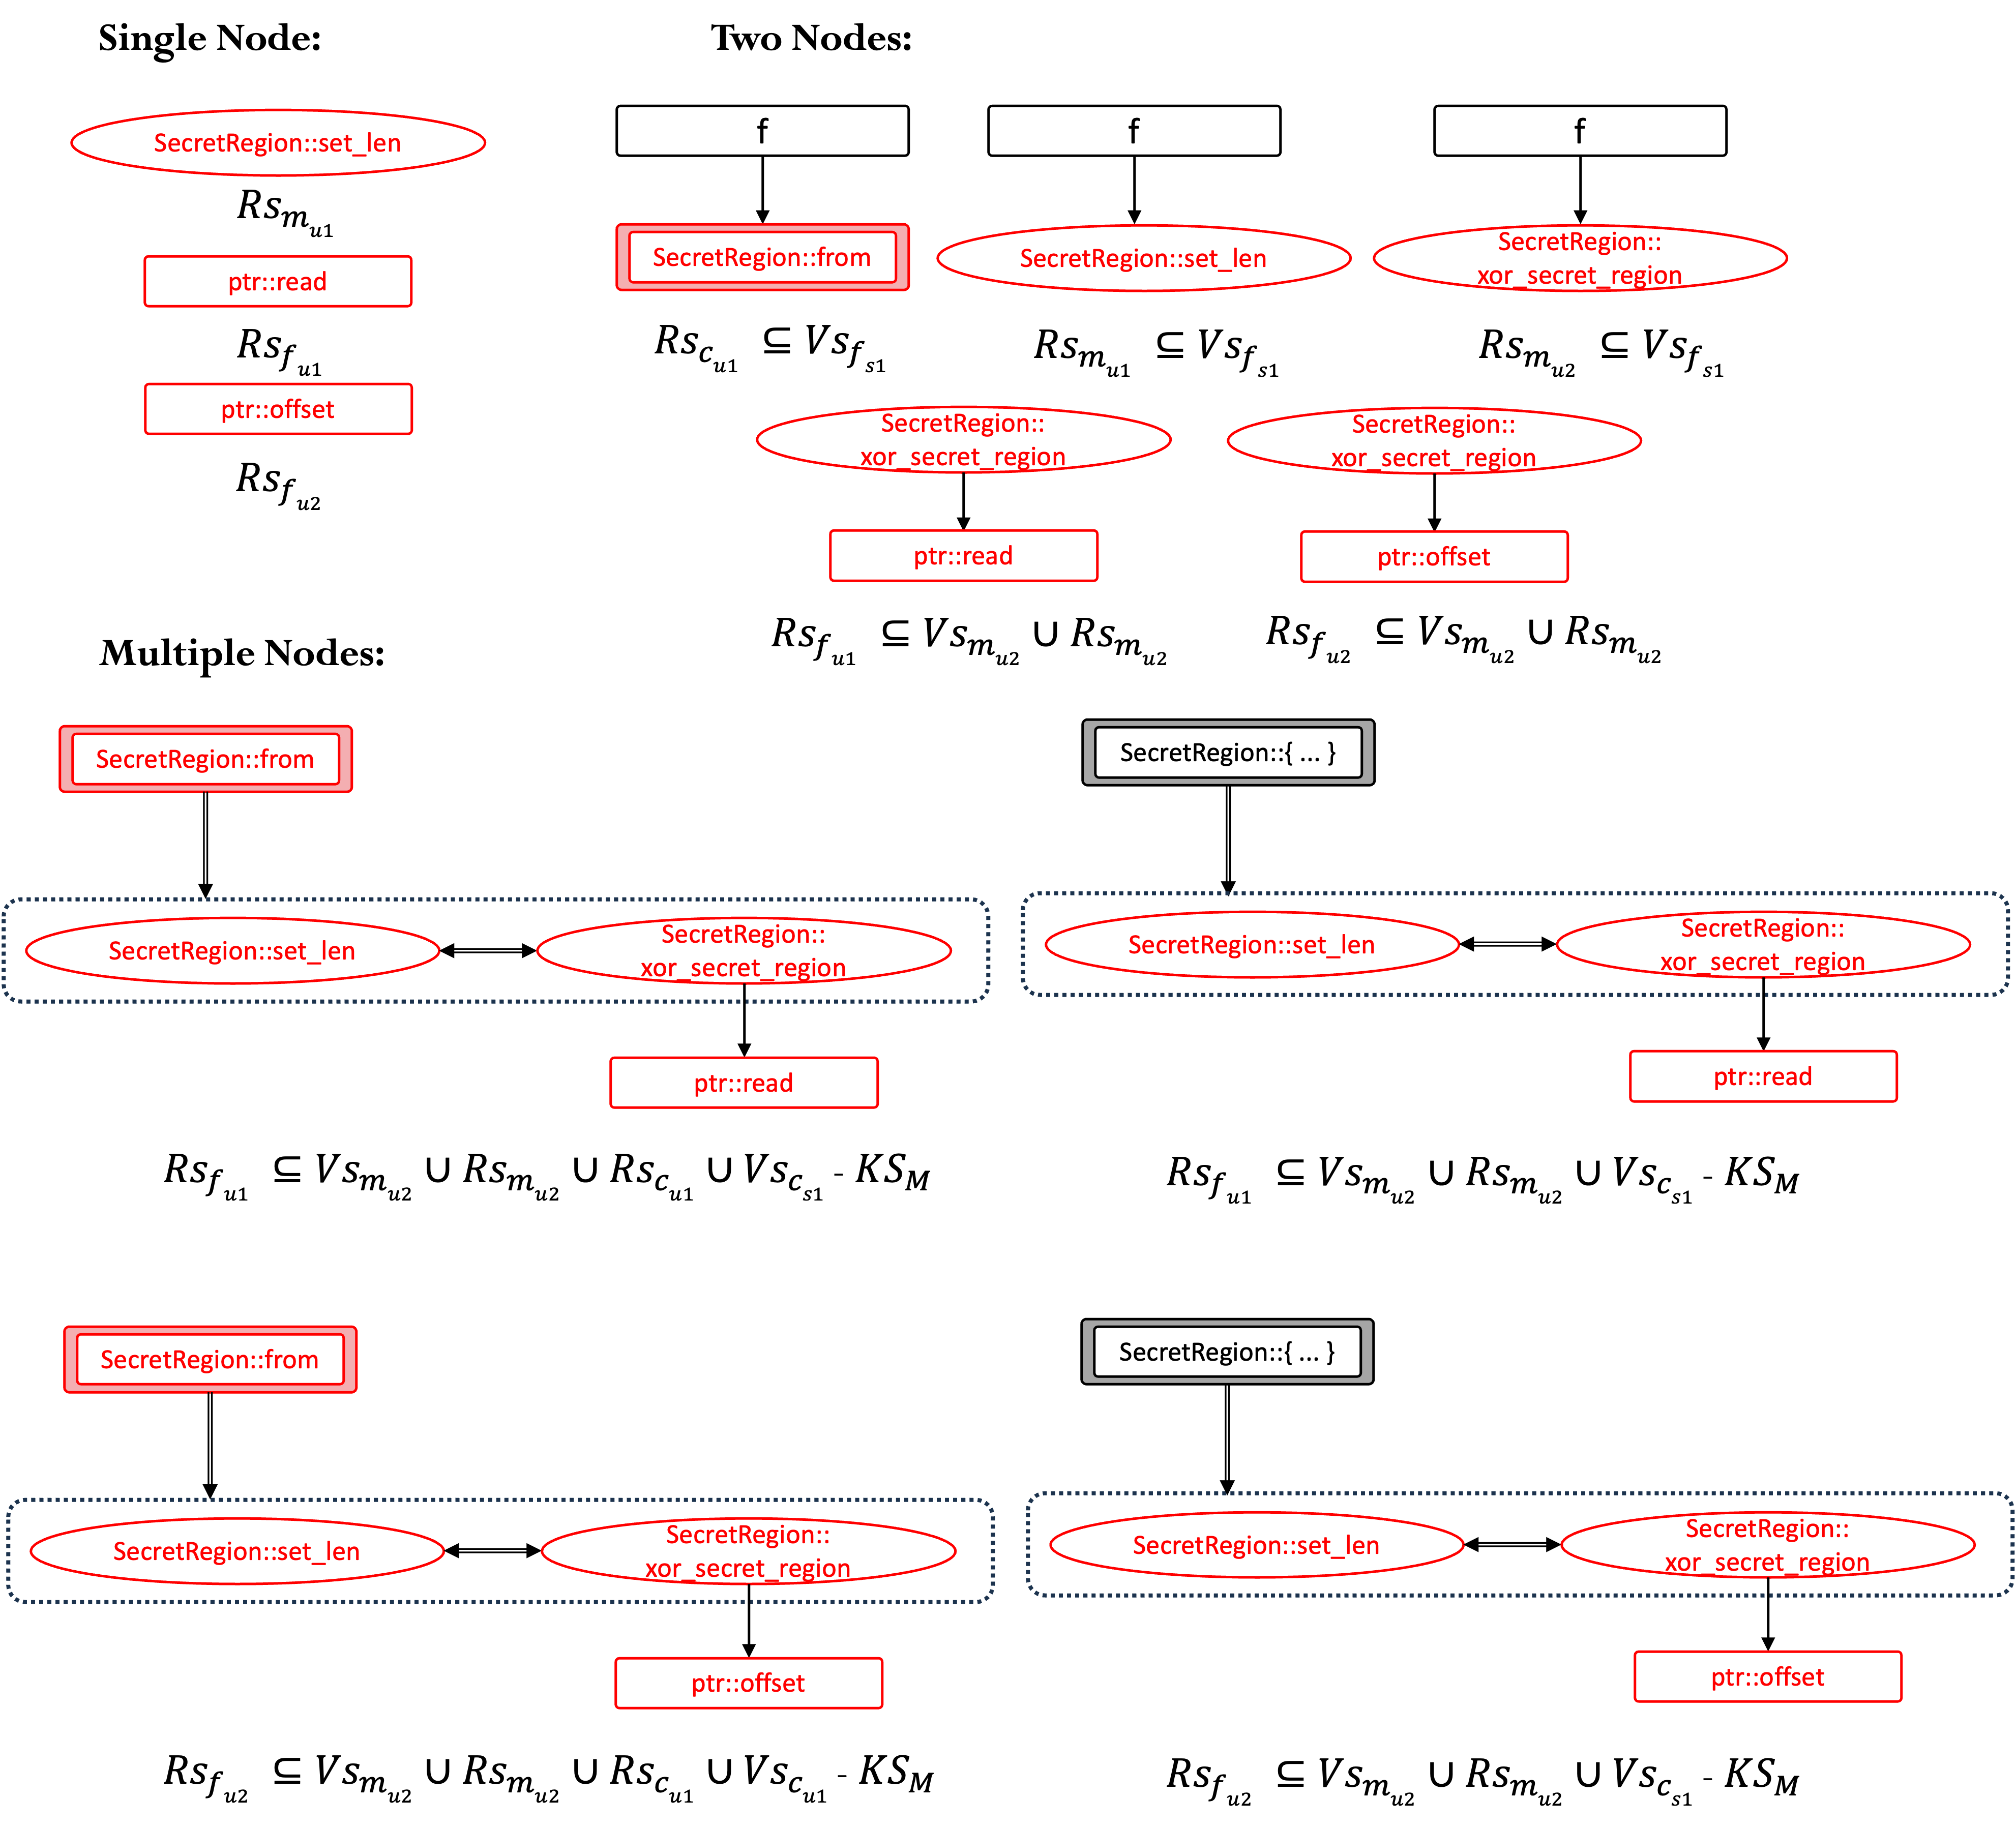 Fig-1b: Basic units generated by splitting Fig-1a. Each basic unit involves a non-trivial safety requirement that should be audited, and it cannot be further simplified.
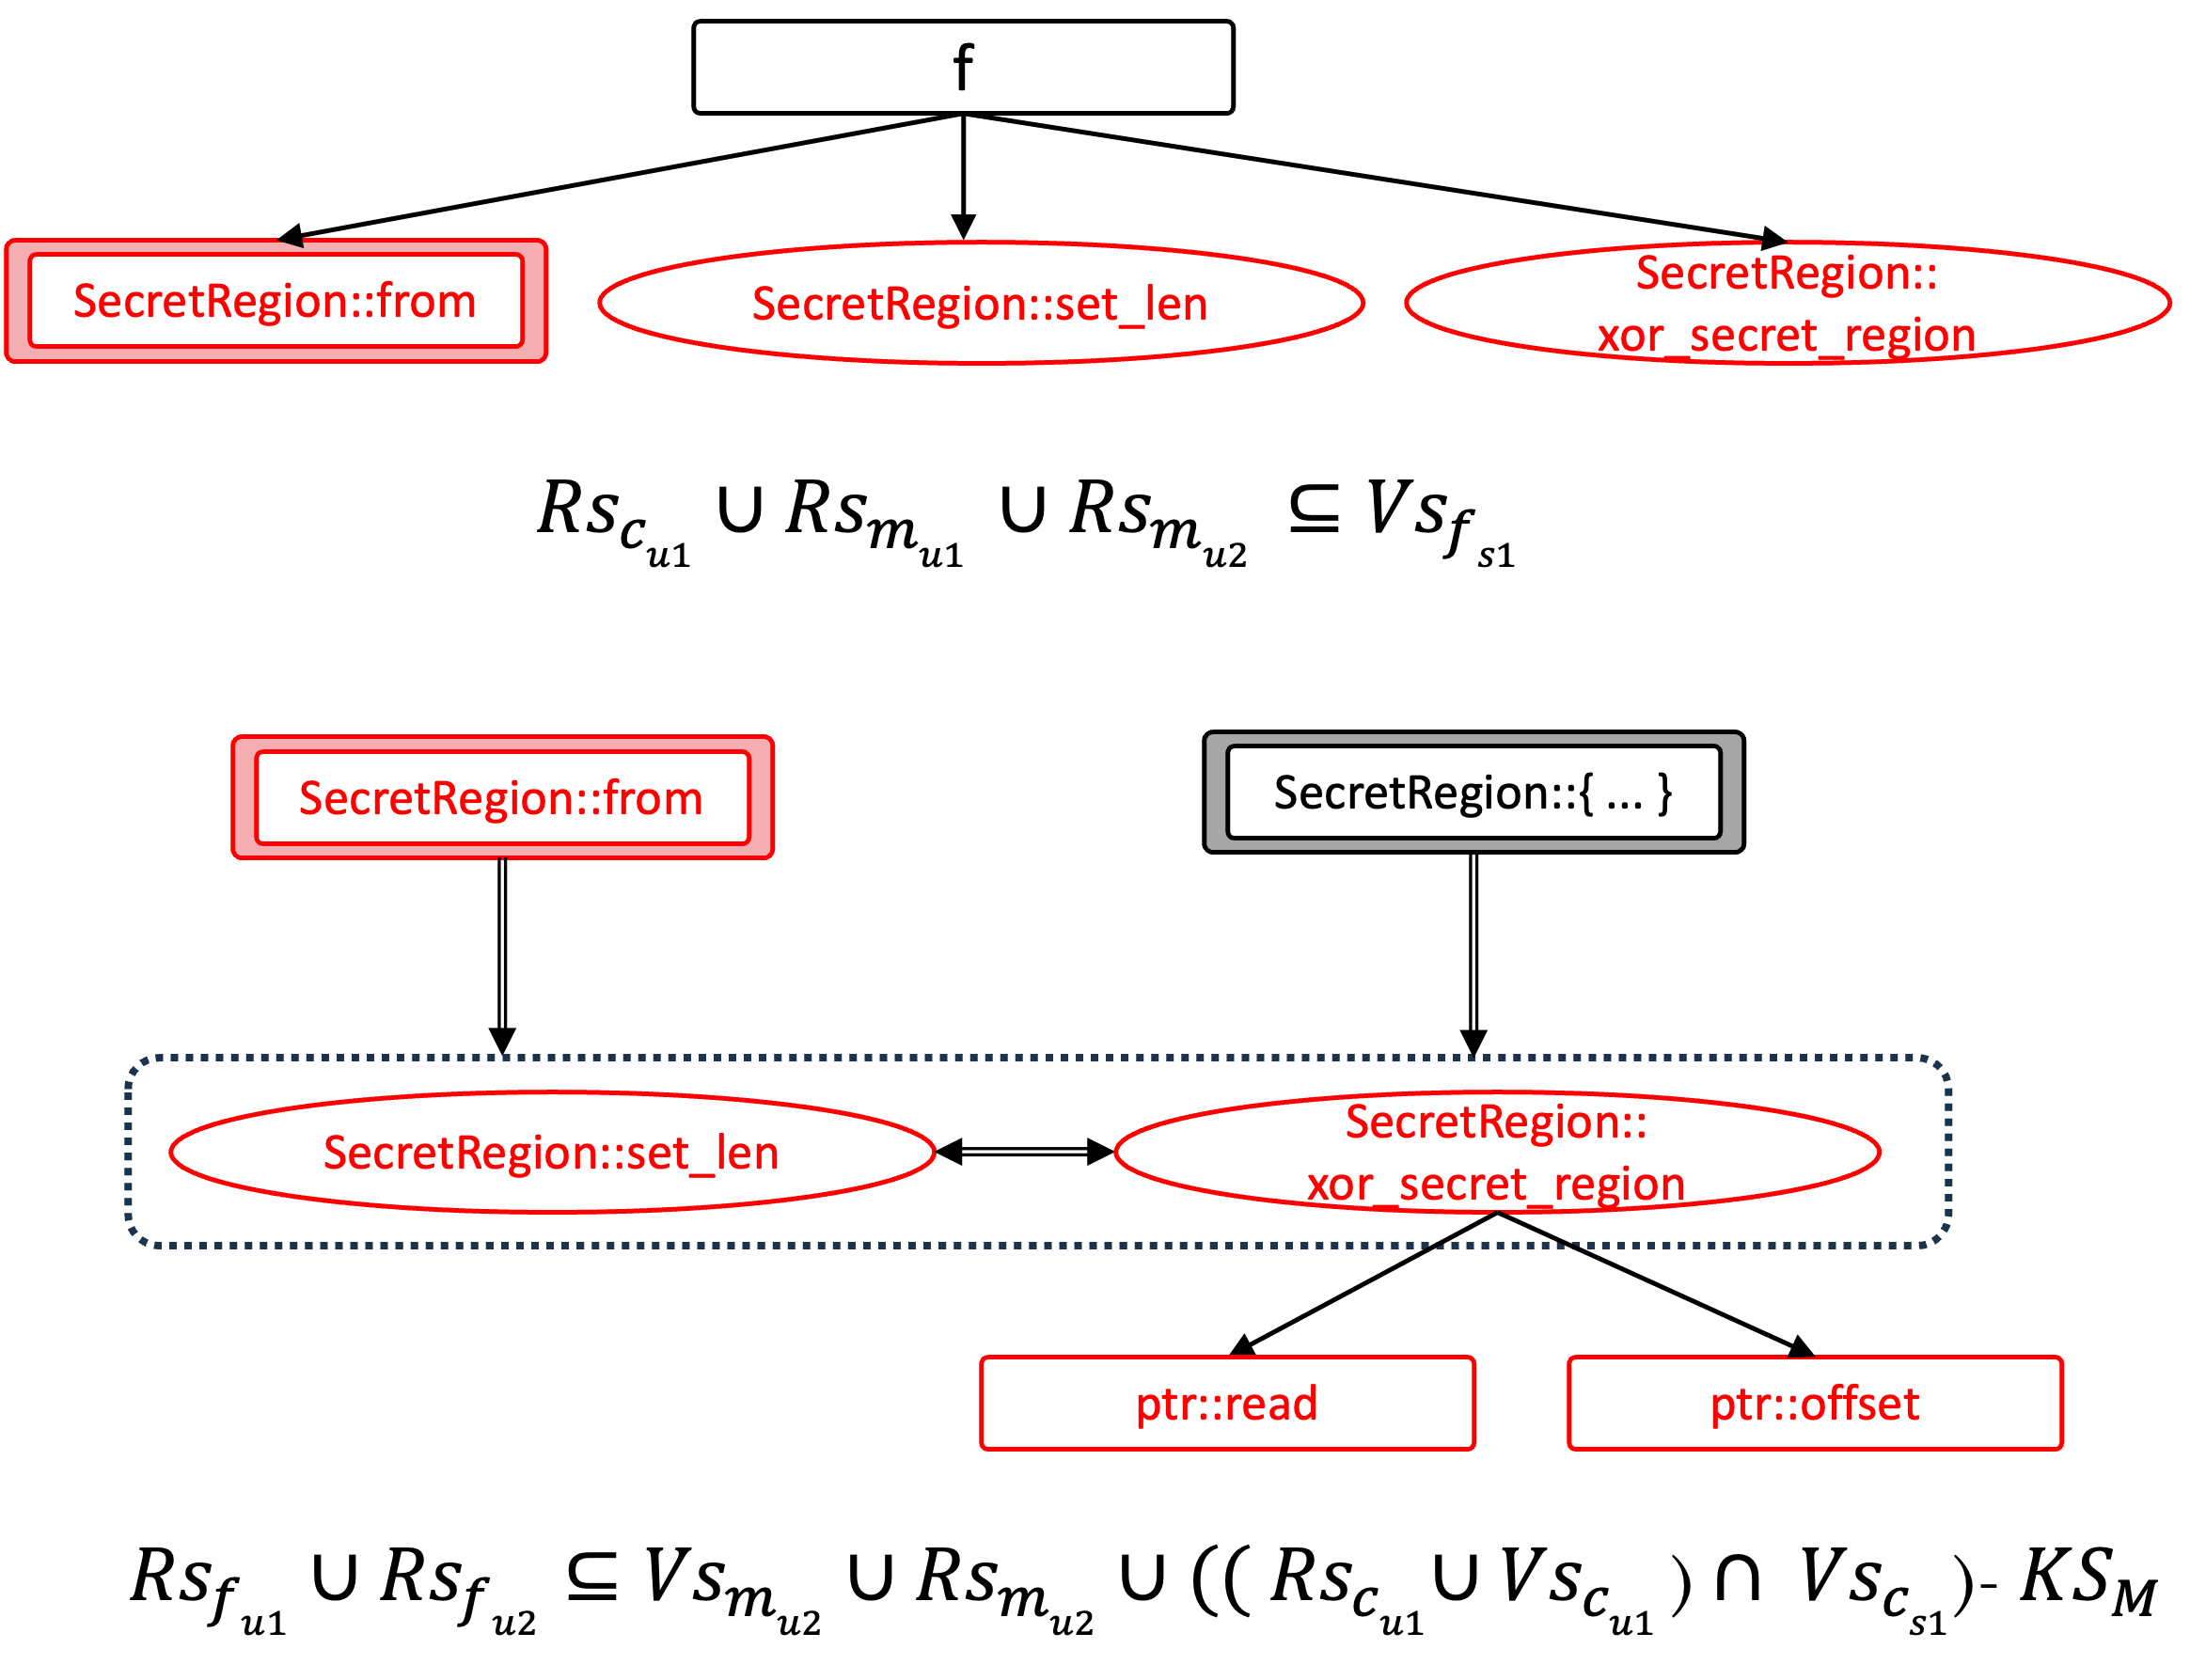 Fig-1c: Audit units generated by merging Fig-1b. Each audit unit has its corresponding audit formula.
3 Safety Property Verification
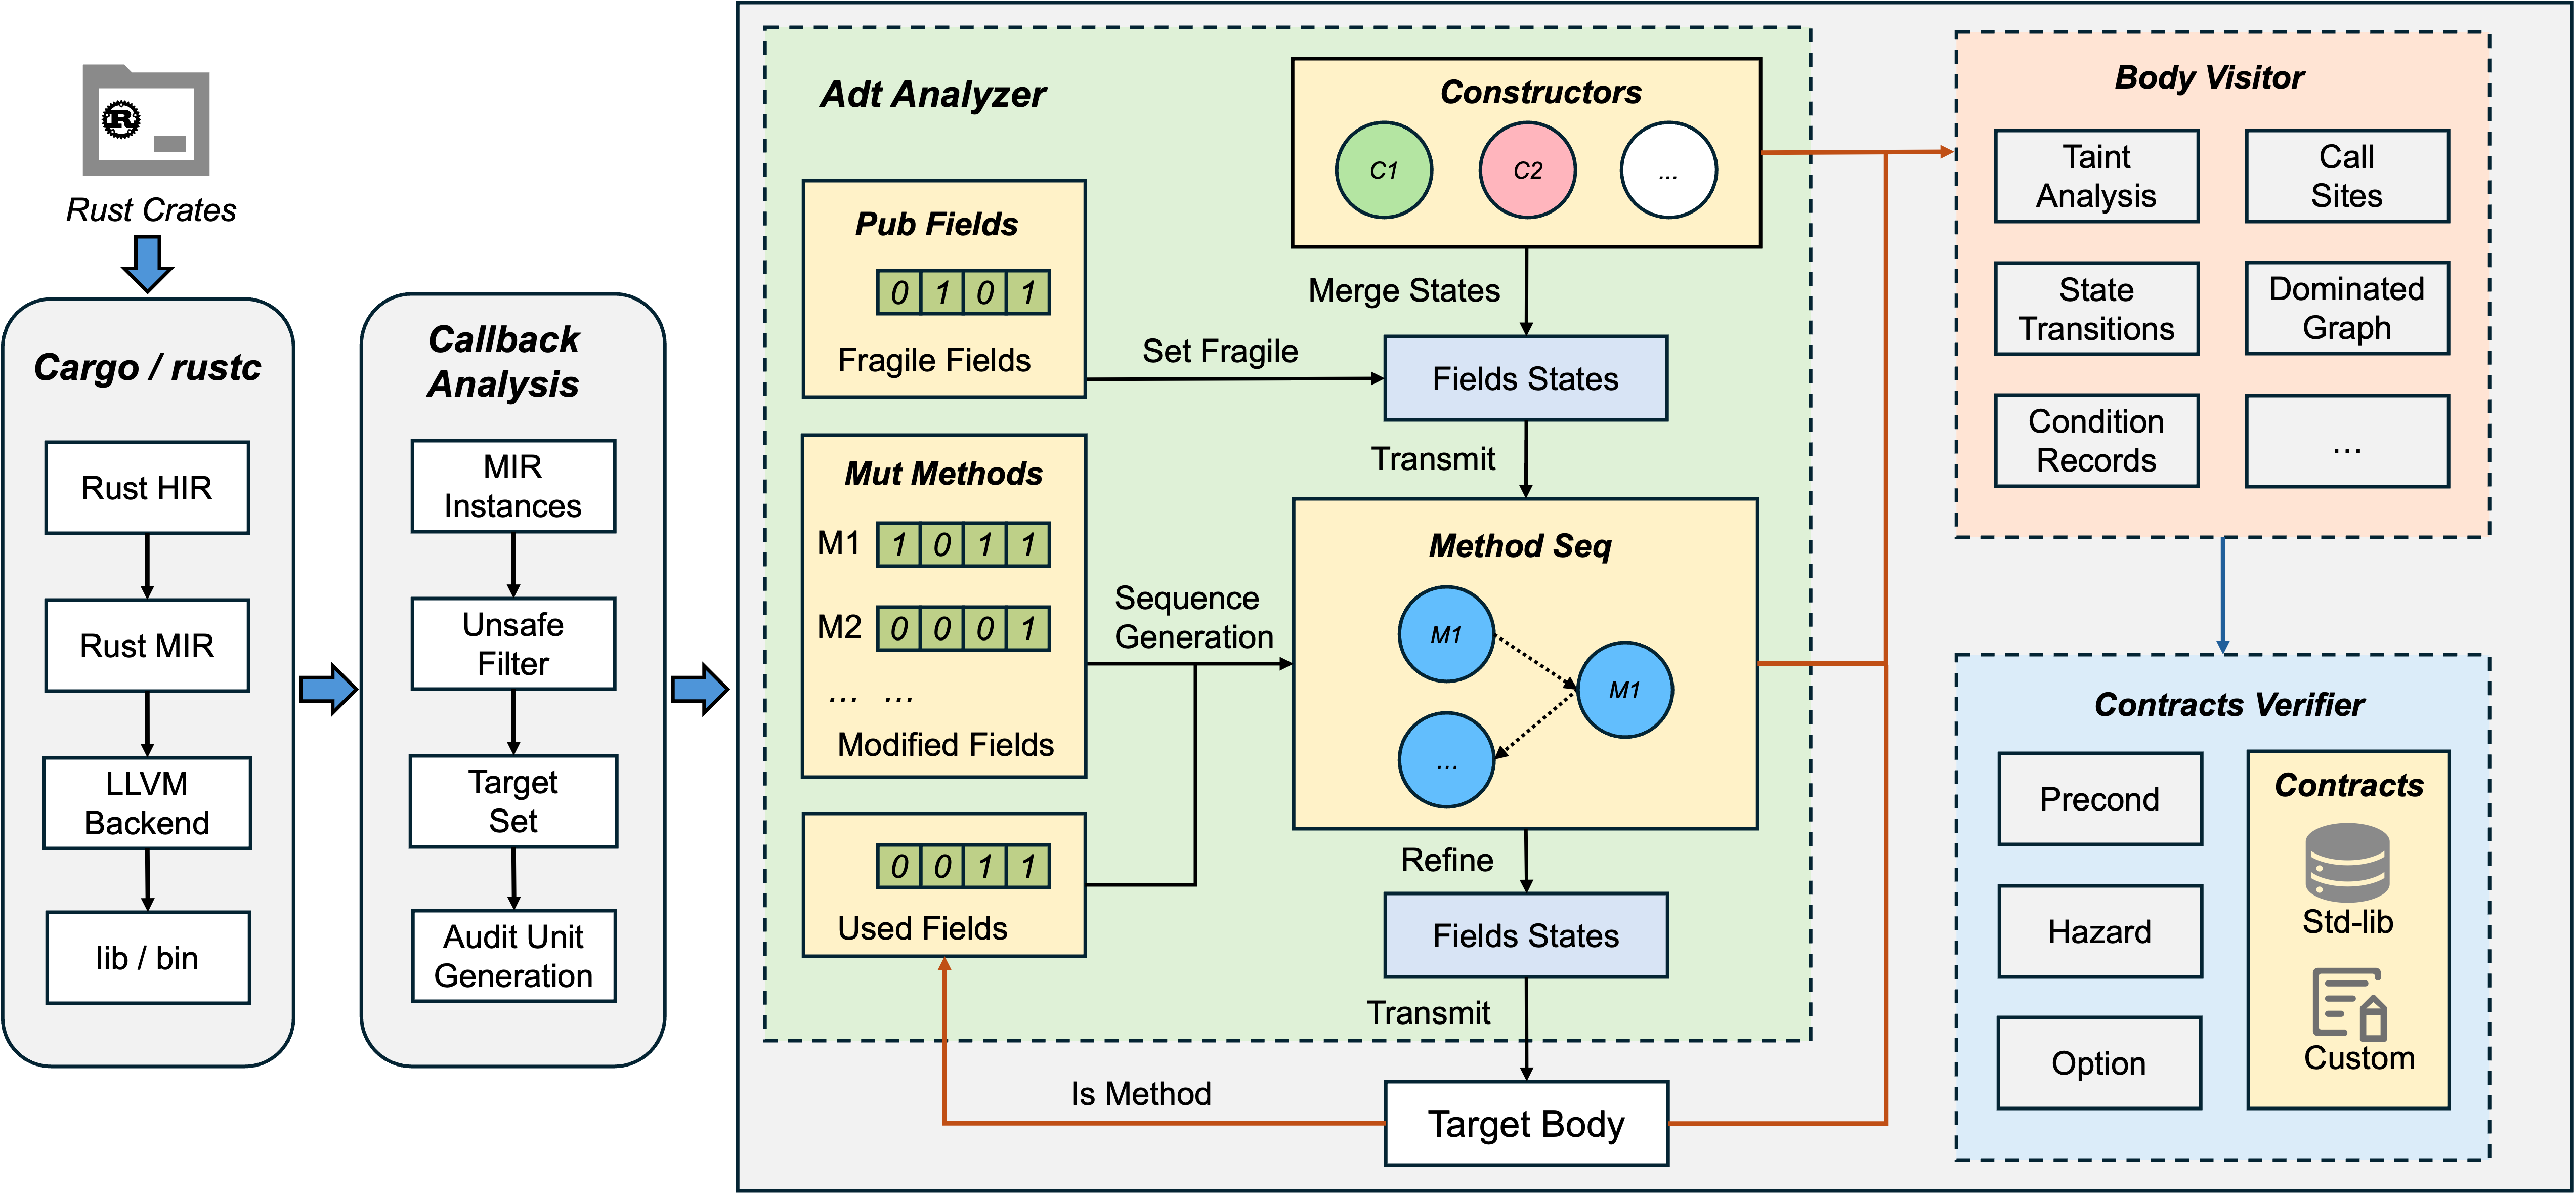
Senryx is the module within RAPx responsible for verifying safety properties. Building upon abstract interpretation, Senryx employs a contract-based verification approach to verify whether the audit formulas in the audit unit are satisfied. It operates as follows:
(1) Compiler-Integrated Target Identification:
RAPx leverages Rust's compiler callback to identify MIR instances and filter unsafe code segments as target set. Corresponding audit unit will be generated for each target, which serves as the basic verification entity for Senryx.
(2) Stateful Field Analysis
Senryx performs data-flow and state tracking on MIR bodies. If the audit unit is of a multiple-node type, meaning the target is a method, the ADT analyzer will be loaded. The method's constructors and other mutable methods will be evaluated for field modification patterns.
-
Fragile Fields: The public fields within a structure are considered fragile because they can be accessed and modified from outside constructors. We are still exploring and evaluating the impact of fragile fields on safety properties.
-
Modified Fields: Modified fields will generate the method sequence, which is used to determine all possible pre-target states. This analysis is necessary because it accounts for side effects. For example,
St2::set_lenwill makeSt2::getget into a hazard state in Section 2.
(3) Control-Flow Modeling
Body visitor employs MOP to capture state transitions and construct dominated graphs (see Section 3.2 for more details).
(4) Contract-Based Safety Verification
Contract verifier will be applied to check whether all the safety properties of the unsafe callees are fully satisfied (see Section 3.1 for more details).
3.1 Contract Construction
Senryx establishes a rigorous verification system using annotated safety contracts for Rust's standard library.
We maintain an annotated fork of Rust standard library where every unsafe API is tagged with its required safety properties using tag-std format. For example:
#![allow(unused)]
fn main() {
#[rapx::inner(property = InBounded (self, T, count), kind = "precond")]
#[rapx::inner(property = ValidNum (count * size_of(T) <= isize::MAX), kind = "precond")]
pub const unsafe fn offset(self, count: isize) -> *const T
}
Usage
cd /to-be-verified-crate/

export RUSTUP_TOOLCHAIN=nightly-2025-06-02
export __CARGO_TESTS_ONLY_SRC_ROOT=/path-to-pre-annotated-std-lib/library

// In Linux
cargo +nightly-2025-06-02 rapx -verify -- -Zbuild-std=panic_abort,core,std --target x86_64-unknown-linux-gnu
// In Mac(Arm)
cargo +nightly-2025-06-02 rapx -verify -- -Zbuild-std=panic_abort,core,std --target aarch64-apple-darwin
3.2 Program State Modeling via Dominated Graphs
Senryx verifies safety properties through sophisticated state modeling at Rust's MIR level. The core approach tracks variable states along execution paths using a Dominated Graph (DG) data structure that captures two complementary state perspectives:
(1) All annotations preceding the unsafe code will construct the Contractual Invariant States (CIS) of the arguments;
(2) The static analyzer analyzes step by step along the MIR path and infers the Operational Trace States (OTS) based on the semantics.
To demonstrate how Senryx tracks program states and verifies safety contracts, we'll use the xor_secret_region method from Section 2 as our running example.
3.2.1 Safety Contract Declaration for Unsafe Target
In our verification process:
-
Safe functions undergo direct verification to ensure they properly encapsulate unsafe operations
-
Unsafe functions first require annotations of their safety requirements. These annotations will be used as fundamental invariants to verify internal unsafe callees' requirements.
For our target method xor_secret_region as example, since it is an unsafe method, we pre-examine its function body and declare:
#![allow(unused)]
fn main() {
// ValidPtr (ptr, u32, 1)
// Aligned (ptr, u32)
// Init (ptr, u32, 1)
// ValidNum (offset >= 0)
// ValidNum (self.size >= offset)
// ValidNum (offset * 4 <= isize::MAX)
// Allocated (self.buffer, u32, self.size)
// Init (region.buffer, u32, region.size)
pub unsafe fn xor_secret_region(
    &self,
    ptr: *mut u32,
    offset: isize,
) -> u32 {
    let mut src_value = ptr.read();
    let secret_ptr = self.buffer.as_ptr();
    let secret_region_ptr = secret_ptr.offset(offset);
    let secret_value = secret_region_ptr.read();
    src_value ^= secret_value;
    src_value
}
}
3.2.2 CIS Construction
Pre-defined annotations translate directly into CIS and serve as the foundation for subsequent state tracking.
To support more granular state binding, we introduce specialized shadow variables to represent:
- Pointer Memory: For pointer variables, we create shadow variables to track the state of the memory they reference (e.g., Var9 in the figure below, it has been re-encoded).
- Field-Sensitive: For structure fields, we extend to field-level granularity (e.g., Var1.0, Var1.1 in the figure below) to capture fine-grained state transitions.
3.2.3 OTS Construction
Subsequently, Senryx will perform state assignment for the variables based on the statements of MIR:
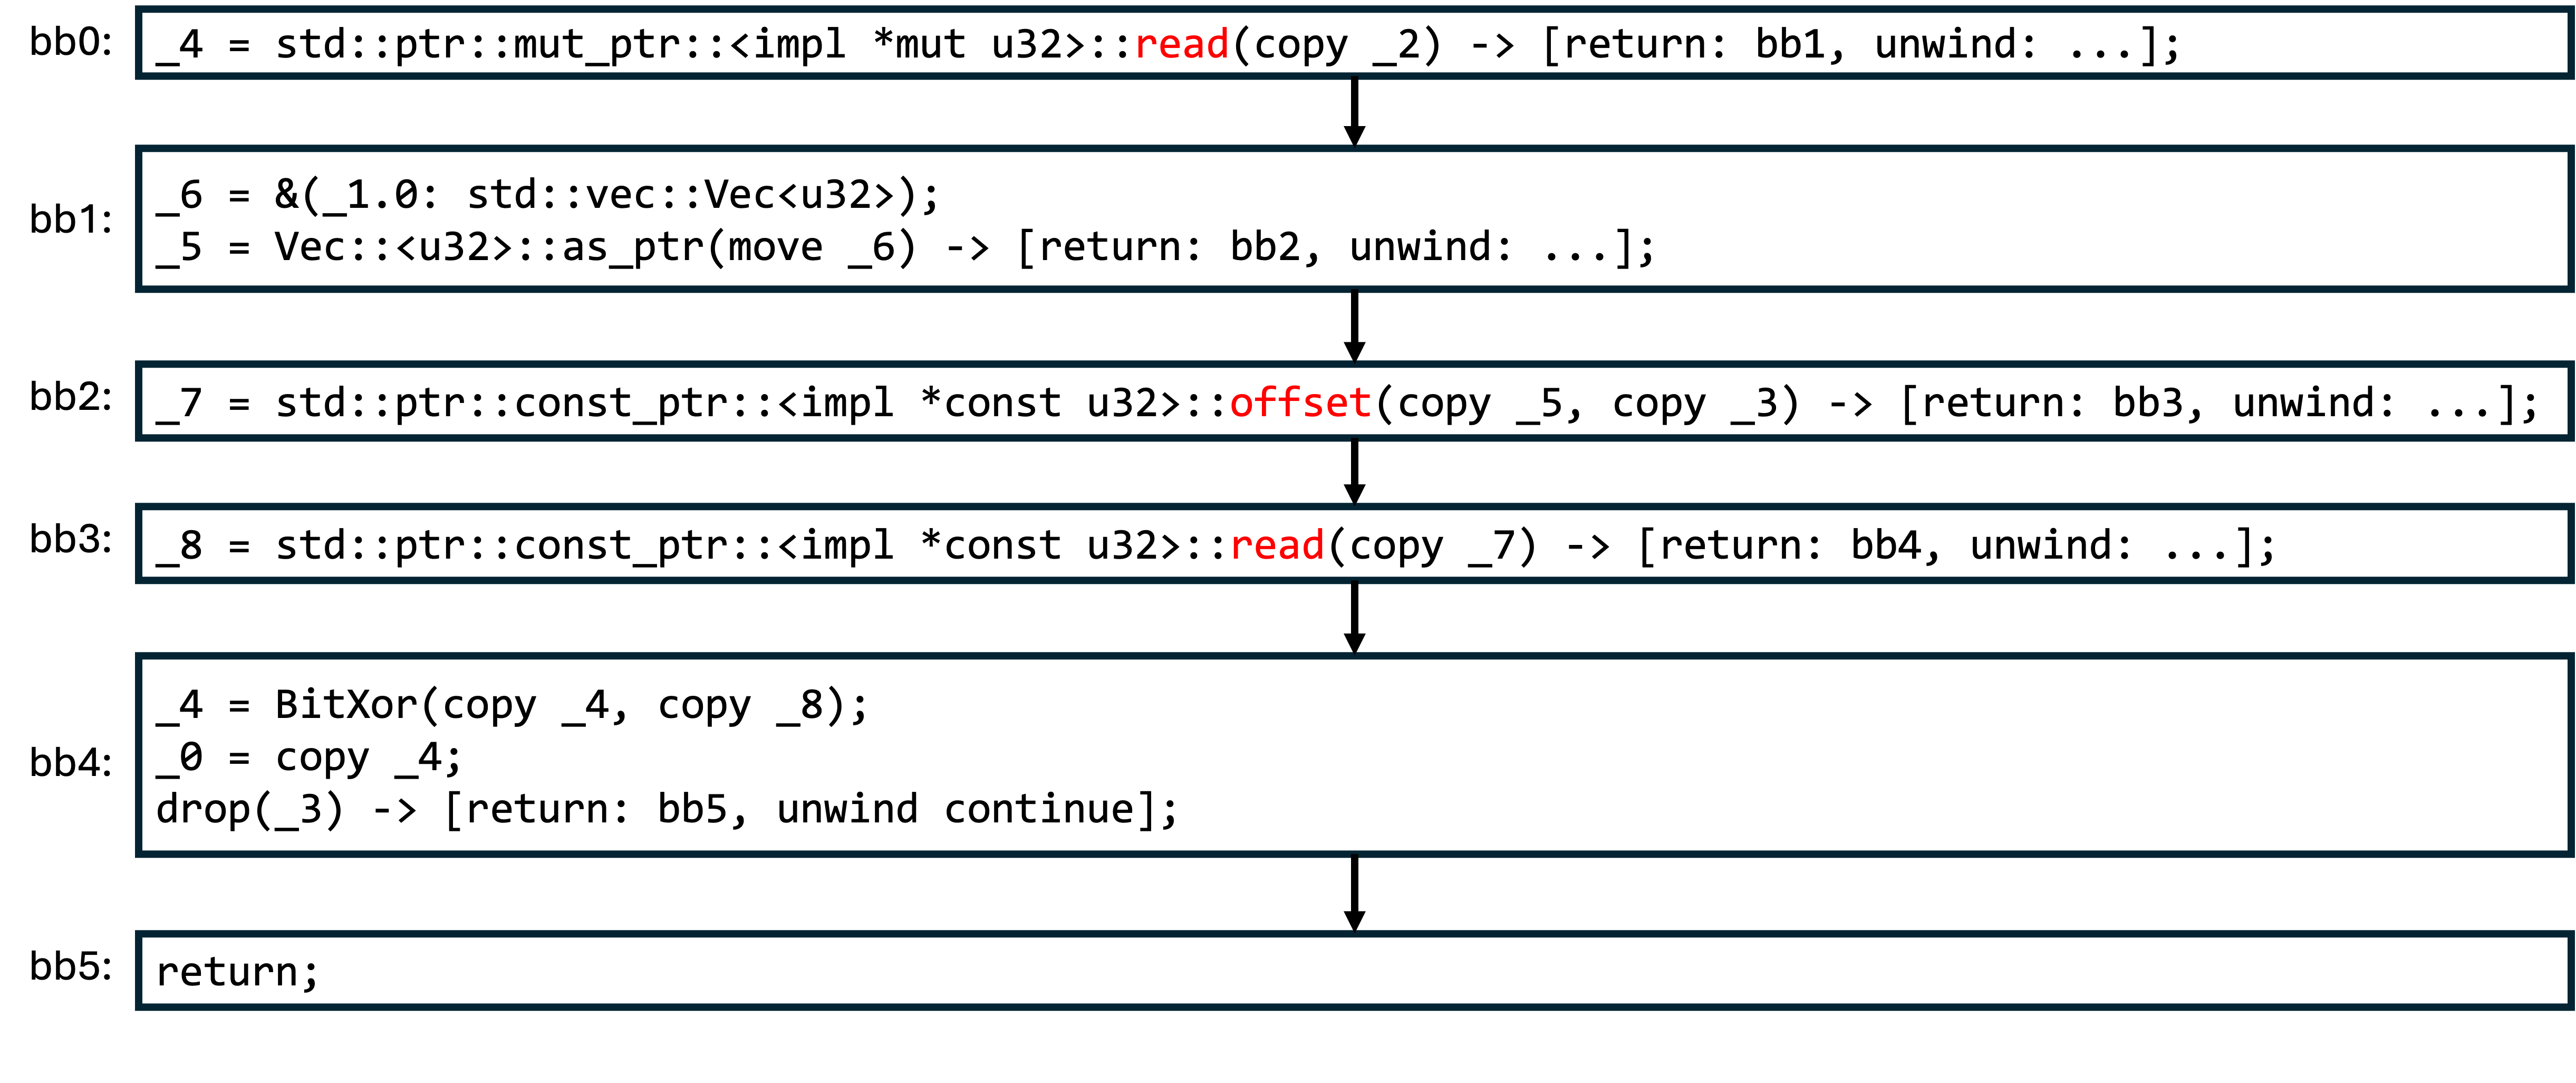 Take
Take _5 = Vec::<u32>::as_ptr(move _6) as example, the original memory (Var1.0 pointed by Var6) has the Allocated and Init states, the generated alias pointer Var5 also inherits this state and has the ValidPtr semantic.
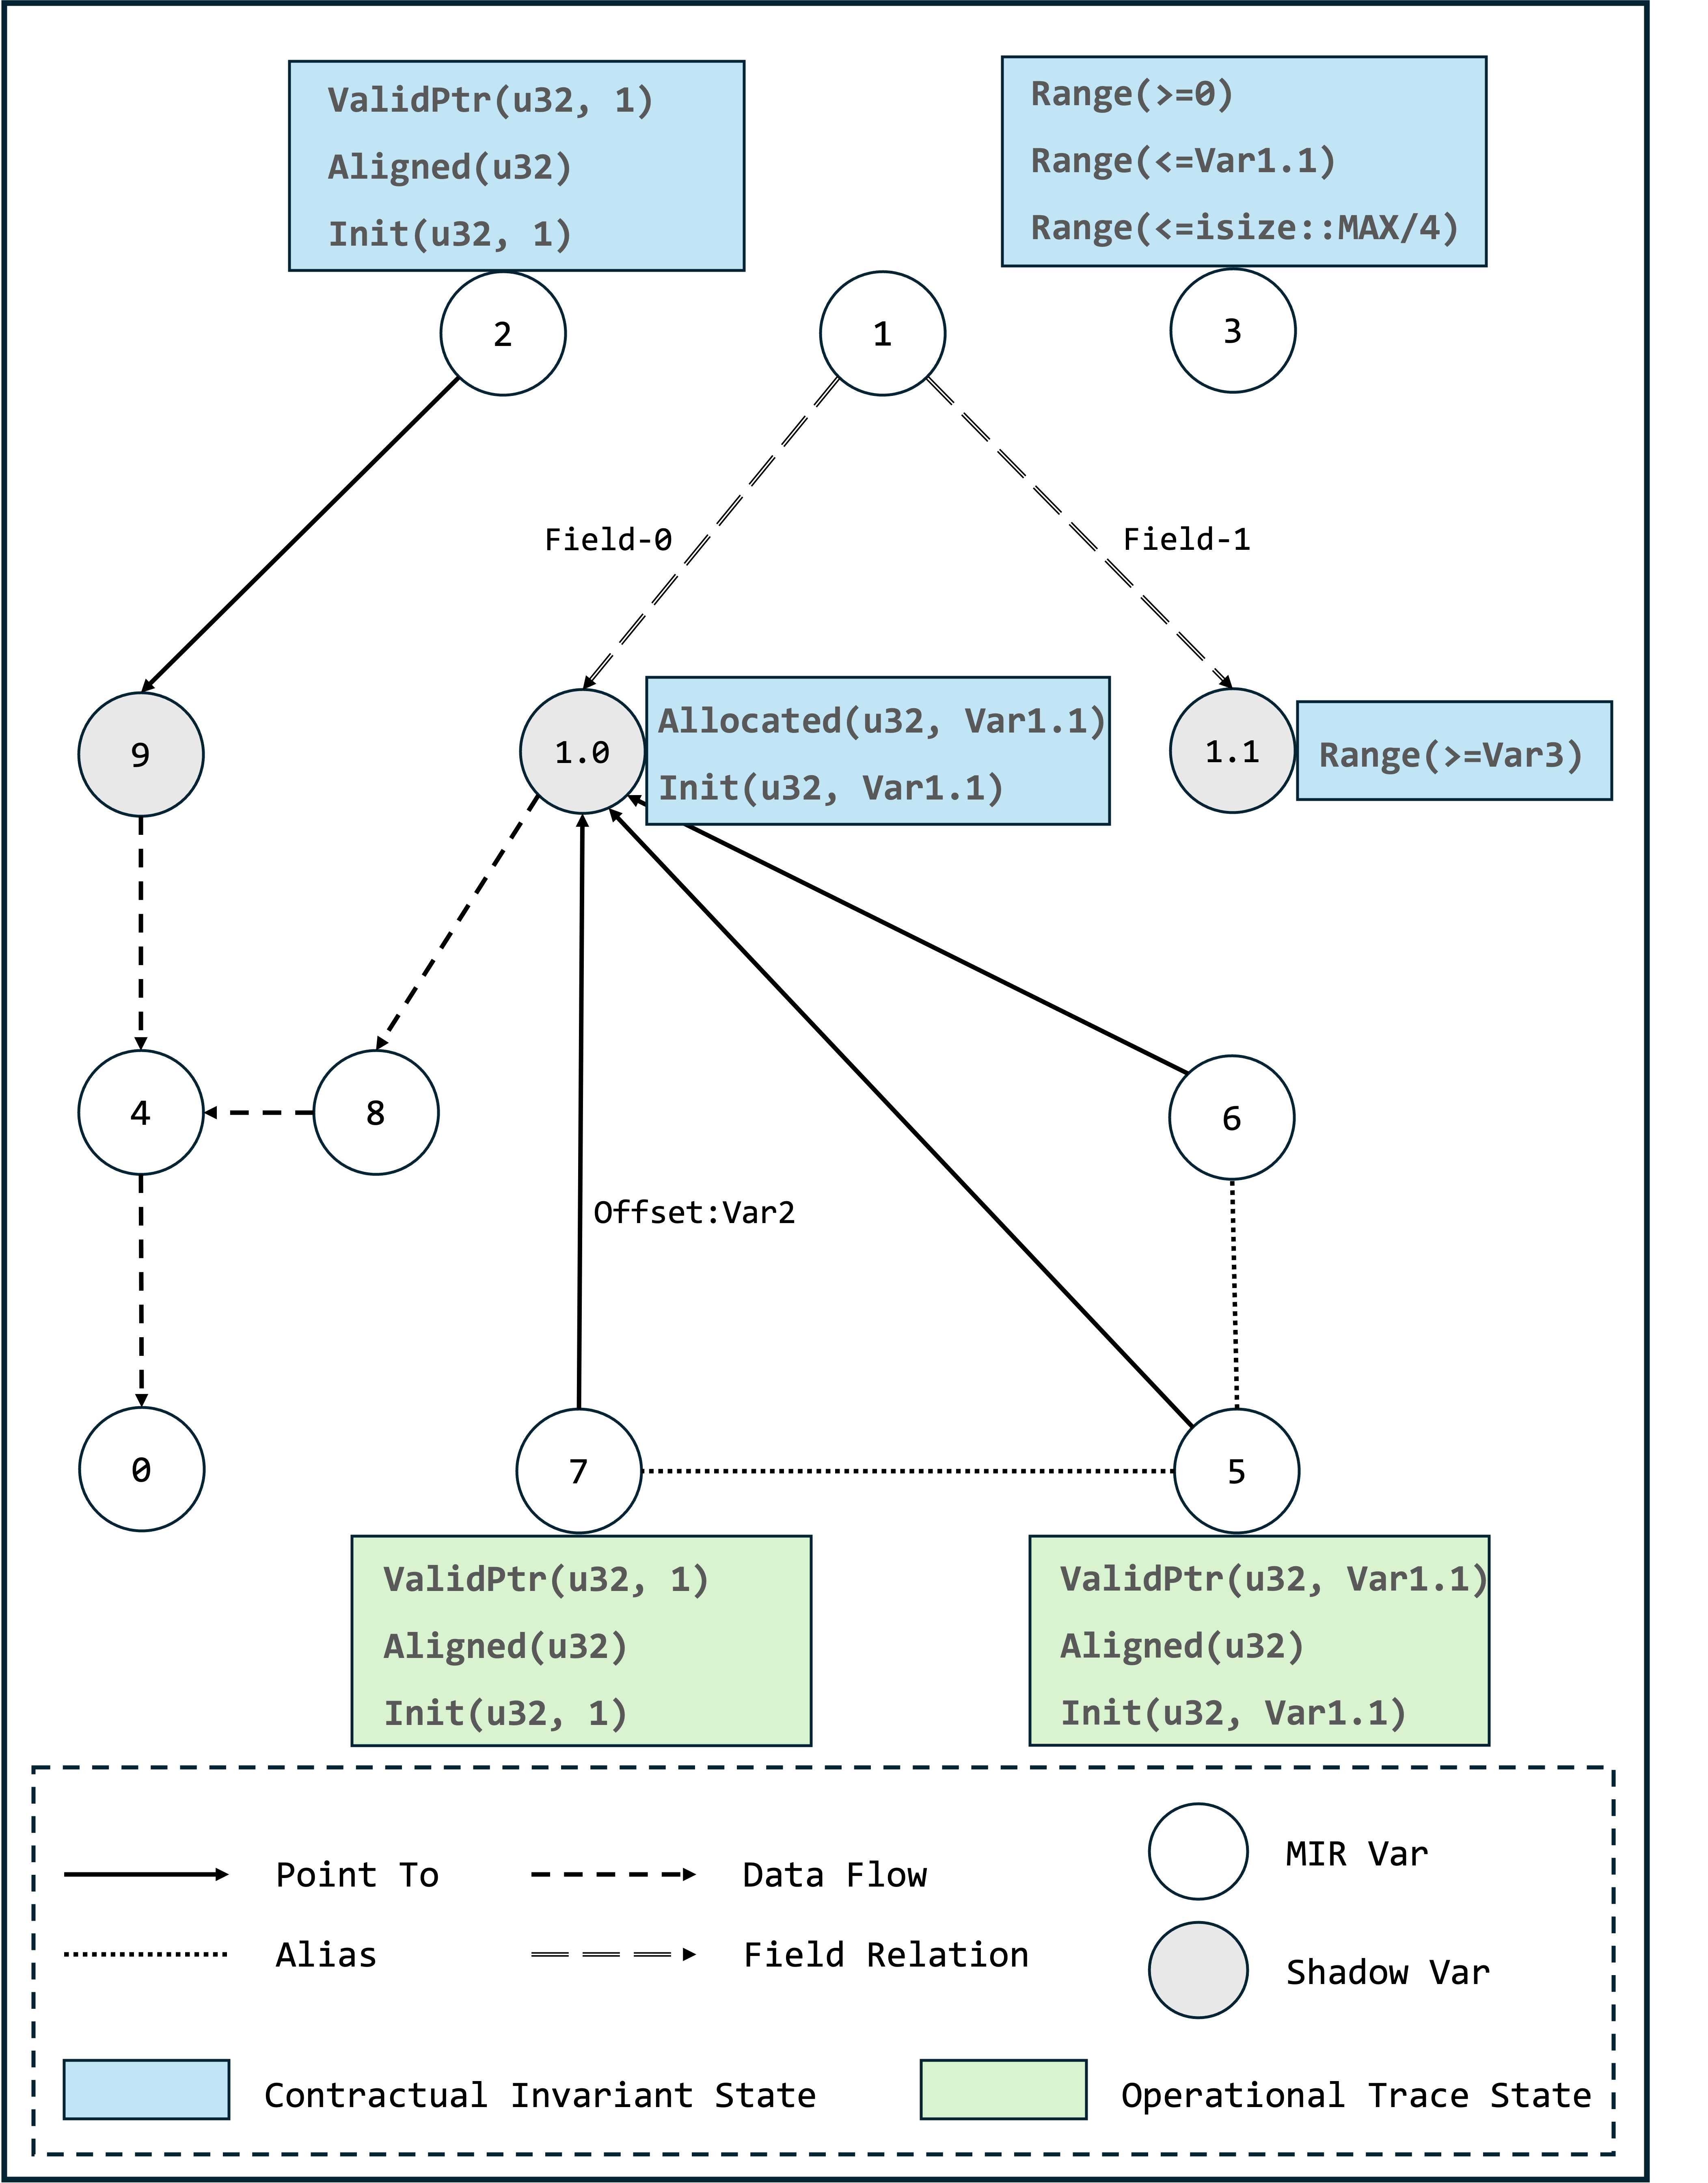
After all the statements on the path have been checked, we will obtain the final dominated graph. The process can be summarized as follows:
-
Input parameters are analyzed first: any pointer or reference (like read in dg1) triggers the creation of a dedicated shadow variable node (e.g., ValidPtr(u32, 1) in dg2) to represent its memory properties. Composite types are decomposed so that each field gets a dedicated node (e.g., Var1.0, Var1.1 for struct fields).
-
Using abstract interpretation, we analyze MIR statements to infer relationships and constraints. Pointer operations (like dereferences or offsets) will all be recorded in detail. For example, when a pointer arithmetic call (
ptr::offset) occurs, a new derived variable (Var7) is generated from the base pointer (Var5) with an explicit offset (Var3). Theoffset: Var3indicates that it will be offset byVar3 * sizeof(u32)bytes from the object's base address. -
Data dependencies are established for value transfers and operations. For example, the
_4 = BitXor(_4, _8)will create dataflow between Var4 and Var8.
3.2.4 Safety Contract Checking
Whenever an unsafe call site is encountered, this step will be executed to detect the target contracts. In this case, we should verify the contracts of ptr::read and ptr::offset.
The verification engine validates safety contracts through state unification between OTS and CIS. For example, consider the ptr::offset's callsite and signature:
#![allow(unused)]
fn main() {
// callsite:
_7 = std::ptr::const_ptr::<impl *const u32>::offset(copy _5, copy _3)

// signature:
pub const unsafe fn offset(self, count: isize) -> *const T

// transition of arguments names to MIR variables
self => Var5
count => Var3
}
Subsequently, we verify ptr::offset's two contracts based on the states of Var5 and Var3.
(1) InBounded (self, u32, count) => InBounded (Var5, u32, Var3)
- Var5 has OTS:
ValidPtr(u32, var1.1).ValidPtris a composite SP, which impliesInBounded(u32, var1.1).
   Var5: ValidPtr(u32, var1.1)
=> Var5: InBounded(u32, var1.1)
=> Var5: InBounded(u32, var1.1) + Var1.1 >= Var3
=> InBounded (Var5, u32, Var3)
=> Pass!
(2) ValidNum (count * size_of(T) <= isize::MAX) => ValidNum (Var3 * size_of(u32) <= isize::MAX)
- Var3 has the CIS:
Range(<=isize::MAX/4).
   Var3 <=isize::MAX/4
=> Var3 * size_of(u32) <= isize::MAX
=> ValidNum (Var3 * size_of(u32) <= isize::MAX)
=> Pass!
3.3 Vulnerable Path Analysis
Before reaching the unsafe call site, we need to track the variable states of its arguments. They may be affected by other variables along the path. We refer to such paths as vulnerable paths.
If the analysis target is a method taking self as an argument, its vulnerable path comprises two components:
- Inter-procedural paths combining constructors and mutable methods. This can be referred to in the Adt Analyzer section of the above architecture diagram. The algorithm for generating mutable method sequence is still under development.
- Intra-procedural paths from the function's entry point(s) to unsafe call sites within the method body.
If the analysis target is a function without a self parameter, only the latter is considered.
4 Safety Property Inference
4.1 audit unsafe APIs' SP in core and alloc
Specifically, we currently integrate a set of SP labels analysis for core and alloc crate of the Rust standard library.
- Create a new
helloworldproject. - Navigate to the
helloworldproject directory and run:
cargo rapx -stdsp -- -Zbuild-std --target x86_64-unknown-linux-gnu > /your/output/log/path/result.log 2>&1
Replace /your/output/log/path with your desired output directory. This will output APIs where the caller and callee have different SPs.
5 Soundness and Precision
RAPx provides sound detection of undefined behavior - if any path in the program contains UB, it will be reported. This guarantee comes with inherent over-approximation of program paths, which may yield false positives where reported UB paths are infeasible in concrete execution.
5.1 Granular Safety Property Detection Approach
RAPx operates at the abstraction level of Safety Properties (SPs) - fundamental invariants that must hold to prevent undefined behavior - rather than analyzing UB manifestations directly. This approach provides:
-
Condition Focus: SPs represent necessary conditions for UB (e.g., valid alignment before dereference)
-
Pattern-Specific Analysis: Detect defect patterns for per SP rather than symptomatic UB types
Currently, we've completed defect pattern research for some tag-std SPs. Using Align SP as our demonstration case, we'll explain how RAPx achieves soundness at the MIR level.
5.2 Demonstration Framework: Align SP in MIR
Analysis Foundation:
-
The MIR statement types are finite and well-defined
-
Pointer misalignment originates from a limited set of operations
These characteristics enable comprehensive modeling of all defect patterns in MIR. Specifically, scenarios causing pointer misalignment are enumerable and fall into three categories:
-
Casting: Intrinsic operations changing pointer types
-
Pointer Arithmetic: Pointer arithmetic altering address alignment
-
Untrusted origins: Untrusted origins without alignment validation
These three mechanisms represent fundamental sources of misalignment. We systematically address each root cause through dedicated rules in sections 5.2.1-5.2.3. Additionally, we model secondary propagation scenarios where unaligned pointers contaminate other pointers through copies or derived operations. These propagation pathways are analyzed in section 5.2.4.
We will examine each category through concrete examples and formal rules. All the rules operate on following Align lattice:
L = {Top, Aligned, Unaligned, Unknown}
It has partial ordering:
        Top
      /     \
  Aligned  Unaligned
      \     /
      Unknown
Alignment = 2^k (k ∈ ℕ) represents concrete alignment values as powers of two.
5.2.1 Casting
Type conversion operations are the main source of memory alignment issues. In Rust, when a pointer is forcibly converted from a low-alignment type to a high-alignment type, if the original address does not meet the alignment requirements of the new type, undefined behavior will occur. The following example demonstrates this dangerous conversion:
#![allow(unused)]
fn main() {
fn type_cast_ub() {
    let data = [0u8; 5]; // u8 => one byte alignment
    let ptr = data.as_ptr();
    let unaligned_ptr = ptr as *const u32;
    unsafe {
        // 💥 UB here! Ptr is not 4-byte aligned
        let _value = *unaligned_ptr;
    }
}

Simple MIR of type_cast_ub:
bb 0 {
    Assign((_1, [const 0_u8; 5]))
    Assign((_4, &_1))
    Assign((_3, move _4 as &[u8] (PointerCoercion(Unsize, Implicit))))
    _2 = core::slice::<impl [u8]>::as_ptr(move _3) -> [return: bb1, unwind continue]
}
bb 1 {
    Assign((_6, copy _2))
    Assign((_5, move _6 as *const u32 (PtrToPtr)))
    Assign((_7, copy (*_5))) @ _7=copy (*_5)
    Assign((_0, const ())) @ _0=const ()
    return
}
}
In this example, the memory object (data) is assigned fixed types and one-byte alignment when it is created. Pointer conversion causes the pointer type to be four-byte alignment, inconsistent with the memory object type.
Rust supports two distinct cast operations in MIR statements: PtrToPtr and Transmute cast. To address potential alignment violations, we've established dedicated defect detection rules (Rule1 and Rule2) for these operations:
Rule1 (Casting):
    Γ ⊢ statement: left_ptr = Cast(cast_kind, right_ptr, τ_dst),
        cast_kind ∈ {PtrToPtr, Transmute},
        τ_src = right_var.point_to.type,
        A_src = align_of(τ_src),
        A_dst = align_of(τ_dst)
    ───────────────────────────────────────────────────────────
    Γ ⊢ left_var.point_to = right_var.point_to
        ▸ Tag(left_ptr, Unaligned) if A_src < A_dst
        ▸ Tag(left_ptr, Aligned) otherwise
For Rule1 (Casting), when a pointer (right_ptr) undergoes PtrToPtr or Transmute casting to a destination type τ_dst, the system first retrieves the source type τ_src and its alignment A_src from the pointer's point-to metadata (constructed from dominated graph discussed in section 3). It compares A_src with A_dst. The resulting pointer (left_ptr) inherits the original memory object but is tagged UNALIGNED if A_dst > A_src, indicating stricter alignment requirements are potentially violated; otherwise, it receives the ALIGNED tag.
5.2.2 Pointer Arithmetic
Pointer arithmetic operations pose subtle alignment risks when offsets aren't multiples of the target type's alignment. The following example shows how byte addition can create misaligned pointers:
#![allow(unused)]
fn main() {
fn pointer_arithmetic_ub(value: usize) {
    let data = [0u32; 3];
    let base_ptr = data.as_ptr();
    // Sound pointer arithmetic
    // if value % 4 == 0 {
    //     let misaligned_ptr = unsafe { base_ptr.byte_add(value) };
    // }

    // Unsound pointer arithmetic
    // Unsafe func ptr::byte_add doesn't have the alignment reuqirement.
    let misaligned_ptr = unsafe { base_ptr.byte_add(value) };
    unsafe {
        let _value = *misaligned_ptr; // 💥 UB
    }
}

Simple MIR of pointer_arithmetic_ub:
bb 0 {
    Assign((_2, [const 0_u32; 3]))
    Assign((_5, &_2)) @ _5=&_2
    Assign((_4, move _5 as &[u32] (PointerCoercion(Unsize, Implicit))))
    _3 = core::slice::<impl [u32]>::as_ptr(move _4) -> [return: bb1, unwind continue]
}
bb 1 {
    Assign((_7, copy _3))
    Assign((_8, copy _1))
    _6 = std::ptr::const_ptr::<impl *const u32>::byte_add(move _7, move _8) -> [return: bb2, unwind continue]
}
bb 2 {
    Assign((_9, copy (*_6))) @ _9=copy (*_6)
    Assign((_0, const ())) @ _0=const ()
    return
}
}
In this case, the memory object (data) maintains fixed 4-byte alignment. Pointer arithmetic modifies the offset by byte but not checks whether the offset value is a multiple of 4, creating potential mismatches.
In MIR, this type of operation exists in the form of a function call. So we have corresponding rule as:
Rule2 (P-Arith):
    Γ ⊢ statement: left_ptr = Call(func, [base_ptr, offset_val]),
        func ∈ {ptr::byte_add, ptr::byte_offset, ptr::byte_sub,
            ptr::wrapping_byte_add, ptr::wrapping_byte_offset,
            ptr::wrapping_byte_sub},
        obj_τ = base_ptr.point_to.type,
        base_ptr_offset = base_ptr.offset,
        Δ = abstract_eval(offset_val),
        offset' = base_ptr_offset + Δ
    ───────────────────────────────────────────────────────────
    Γ ⊢ left_ptr.point_to = base_ptr.point_to,
        left_ptr.offset = offset'
        ▸ Tag(left_ptr, Unaligned) if offset' % align_of(obj_τ) ≠ 0
        ▸ Tag(left_ptr, Aligned) otherwise
For Rule2 (P-Arith), during pointer arithmetic calls (e.g., ptr::byte_add), the rule computes the new offset (offset') by abstractly evaluating the offset value (Δ) and adding it to the base pointer's existing offset. The base_ptr.offset is an offset based on the initial address of the object. A specific example can be found in dominated graph's Var_7 in the graph of section 3.2.3. The resulting pointer (left_ptr) references the same memory object but is tagged UNALIGNED if offset' is not divisible by the object type's alignment (i.e., offset' % align_of(obj_τ) ≠ 0), signaling misalignment; otherwise, it is tagged ALIGNED.
Direct numerical manipulation of pointers (e.g., p as usize + offset) also creates alignment risks through a two-step process:
-
PtrToInt: Casting a pointer to an integer strips alignment metadata while preserving provenance -
IntToPtr: Converting the modified integer back to a pointer may violate destination type alignment
Rule3 (PtrToInt):
    Γ ⊢ statement: int_val = Cast(cast_kind, ptr, τ),
        cast_kind = PointerExposeProvenance,
        τ_src = ptr.point_to.type,
        existing_byte_offset = ptr.accumulated_offset,
    ───────────────────────────────────────────────────────────
    Γ ⊢ int_val.provenance = (τ_src, existing_byte_offset)
When encountering a PointerExposeProvenance cast (pointer→integer conversion), the rule records the object's source type (τ_src) and accumulated byte offset (existing_byte_offset). These are stored as provenance metadata attached to the integer value.
Following this cast, abstract interpretation tracks potential arithmetic modifications to the integer value (stored at int_val.changed_value), modeling numerical changes.
Rule4 (IntToPtr):
    Γ ⊢ statement: new_ptr = Cast(cast_kind, int_val, τ_dst),
        cast_kind = PointerWithExposedProvenance,
        (τ_src, existing_byte_offset) = int_val.provenance,
        Δ = abstract_eval(int_val.changed_value),
        new_byte_offset = Δ + existing_byte_offset
        A_src = align_of(τ_src),
        A_dst = align_of(τ_dst),
    ───────────────────────────────────────────────────────────
    Γ ⊢ new_ptr.offset = new_byte_offset
        ▸ Tag(new_ptr, Aligned) if ( new_byte_offset % A_src == 0
                                    ∧ A_src >= A_dst )
        ▸ Tag(new_ptr, Unaligned) otherwise
When converting an integer back to a pointer via PointerWithExposedProvenance cast, the rule:
-
Recovers the original source type (
τ_src) andexisting_byte_offsetfrom provenance metadata -
Computes the new offset change (Δ) via abstract interpretation
-
Derives the final byte offset:
new_byte_offset=existing_byte_offset+ Δ -
Compares alignments between
A_srcandA_dst
The pointer is tagged Aligned only if the final offset satisfies original alignment and destination alignment is weaker.
5.2.3 Untrusted Origins
Pointers from external sources requires explicit alignment validation before use. The example demonstrates direct dereferencing of unverified pointers:
#![allow(unused)]
fn main() {
// Unsafe function accepting untrusted pointer
fn untrusted_sources_ub(ptr: *const u32) -> u32 {
    // 💥 Risk with unaligned external pointer
    unsafe { *ptr }
}

Simple MIR of untrusted_sources_ub
bb 0 {
    Assign((_2, copy _1 as *const () (PtrToPtr)))
    Assign((_0, copy (*_1))) @ _0=copy (*_1)
    return
}
}
Here, the memory object's alignment is unknown since it originates outside the audit boundary. Direct usage without verification violates Rust's safety contracts.
Rule5 (U-Source):
    Γ ⊢ context, statement: left_var = (Copy(ext_ptr) | Move(ext_ptr))
        ext_ptr ∈ {FFI, unvalidated_input}
        ¬∃ alignment_validation(context)
    ───────────────────────────────────────────────────────────
    Γ ⊢ object_var = new shadow_var@(unknown),
        left_var.point_to = object_var,
        ▸ Tag(left_var, Unknown)
        ▸ Until explicit validation or pointing to new object
For Rule4 (U-Source), pointers from untrusted origins (FFI/unvalidated input) trigger the creation of a new shadow memory object with unknown alignment. The pointer (left_var) references this object and is immediately tagged UNKNOWN due to absence of prior alignment validation. This tag persists until either explicit runtime validation occurs or the pointer is reassigned to a known object.
5.2.4 Unalignment Propagation
Unaligned pointer vulnerabilities originate from the above three core operations. Once created, these unaligned states can be propagated through: (i) Direct pointer copies/moves (Rule5), and (ii) Pointer arithmetic that inherits existing unaligned/unknown states (Rule6).
Rule6 (Propagation1):
    Γ ⊢ statement: left_ptr = (Copy(right_ptr) | Move(right_ptr)),
    ───────────────────────────────────────────────────────────
    Γ ⊢ left_ptr.point_to = right_ptr.point_to
        ▸ Tag(left_ptr, right_ptr.tag)
When a pointer (right_ptr) is copied or moved to a new variable (left_ptr), the system transfers both the memory object reference (left_ptr.point_to = right_ptr.point_to) and the alignment tag (left_ptr.tag = right_ptr.tag) directly. This preserves the original alignment state (Aligned/Unaligned/Unknown) during assignment operations without modification.
Rule7 (Propagation2):
    Γ ⊢ statement: left_ptr = Call(func, [ptr, new_offset]),
        func ∈ {ptr::add, ptr::offset, ptr::sub,
            ptr::wrapping_add, ptr::wrapping_offset,
            ptr::wrapping_sub},
        existing_ptr_offset = ptr.accumulated_offset,
        Δ = abstract_eval(new_offset),
        offset' = existing_ptr_offset + Δ,
        ptr.tag ∈ {Unaligned, Unknown}
    ───────────────────────────────────────────────────────────
    Γ ⊢ left_ptr.point_to = base_ptr.point_to,
        left_ptr.accumulated_offset = offset'
        ▸ Tag(left_ptr, ptr.tag)
For other pointer arithmetic calls (e.g., ptr::add/ptr::wrapping_add), when the input pointer (ptr) is already tagged as UNALIGNED or UNKNOWN, the resulting pointer (left_ptr) inherits both the original memory object and the input pointer's alignment tag (left_ptr.tag = ptr.tag), regardless of offset changes.
5.3 False Positives Handling
While inherent over-approximation in abstract interpretation means some false alarms remain unavoidable, the path-sensitive MOP (Meet Over all Paths) approach significantly reduces false positives by reducing the number of state merges in control flow. Currently, the UB reports still require manual review.
6 Verification for Vec in std-lib
6.1 Introduction
We select vec::into_raw_parts_with_alloc as our primary example, demonstrating how RAPx systematically verifies that internal ptr::read operations remain UB-free throughout the vector's lifecycle.
There are three categories to be checked in our audit units:
-
Construction boundaries: Safe/unsafe constructors that establish initial invariants
-
Methods boundaries: Methods modifying vector state (push, pop, set_len, etc.)
-
Unsafe Call Site: Target method with unsafe callee to be verified (e.g. into_raw_parts_with_alloc)
6.2 Constructor Analysis
The verification of vec::into_raw_parts_with_alloc begins with comprehensive constructor analysis. RAPx will systematically examine all Vec constructors to establish baseline invariants that propagate through the vector's lifecycle.
Specifically, Vec includes the following constructors. RAPx then visits each constructor's body sequentially, using abstract interpretation to build the state of Vec fields (e.g., Init, Allocated, InBound states). RAPx employs the Tarjan algorithm to analyze paths within individual function bodies, performing Meet-Over-All-Paths (MOP) analysis at the conclusion of all paths. Interprocedural analysis follows this approach to analyze callees and extract results, with a maximum analysis depth of 10,000. The analysis of constructors primarily records type information, value flow, and memory allocation status (tracking allocator usage via dataflow). The results for Vec<T, A> constructors are summarized in the table below:
| Constructor | Field1: buf(RawVec<T, A>) | Field2: len(usize) |
|---|---|---|
| new_in(alloc: A) -> Vec<T, A> | value flow: alloc -> buf.inner.alloc | 0 |
| with_capacity_in(capacity: usize, alloc: A) -> Vec<T, A> | value flow: alloc -> buf.inner.alloc \ Allocated(capacity) | 0 |
| try_with_capacity_in(capacity: usize,alloc: A) -> Result<Vec<T, A>, TryReserveError> | value flow: alloc -> buf.inner.alloc \ Allocated(capacity) | 0 |
| from_raw_parts_in(ptr: *mut T, length: usize, capacity: usize, alloc: A) -> Vec<T, A> | value flow: alloc -> buf.inner.alloc \ Allocated(capacity) | length |
| from_parts_in(ptr: NonNull | value flow: alloc -> buf.inner.alloc \ Allocated(capacity) | length |
In the verification for vec::into_raw_parts_with_alloc, only the alloc field is used with unsafe operations, so the memory allocation results from constructor analysis are not fully exercised here (but they can find broader application in other Vec APIs).
Before proceeding to the next step, the field states from all constructors are merged to establish comprehensive initial states.
6.3 Methods Sequence Analysis
Following constructor analysis, we examine how method sequences affect vector state transitions - a property we term Struct Soundness. RAPx analyzes every method with mutable self in Vec's implementation, generating a sequence of modified fields for each method. Before verifying the target function, RAPx combines the fields used by the target function with these modification sequences to derive relevant method sequences, then checks their bodies.
For example, vec::into_raw_parts_with_alloc utilizes the field buf.inner.alloc. The analysis must identify all methods that potentially modify the field and evaluate whether soundness is maintained when into_raw_parts_with_alloc is called after any sequence of preceding operations. By tracing possible call sequences leading to into_raw_parts_with_alloc, RAPx ensures that all intermediate states maintain the necessary invariants for safe memory access.
TODO: The sequence generation algorithm is still under heavy development and testing.
6.4 Verifying ptr::read Safety in vec::into_raw_parts_with_alloc
The final verification step focuses directly on the ptr::read operations within into_raw_parts_with_alloc.
Key basic blocks in MIR:
bb 0 {
CleanUp: false
    _2 = std::mem::ManuallyDrop::<std::vec::Vec<T, A>>::new(move _1) -> [return: bb1, unwind continue] @ Call: FnDid: 2129
}
...
bb 7 {
CleanUp: false
    Assign((_16, &_2)) @ _16=&_2 @ Ref
    _15 = <std::mem::ManuallyDrop<std::vec::Vec<T, A>> as std::ops::Deref>::deref(move _16) -> [return: bb8, unwind continue] @ Call: FnDid: 3878
}
bb 8 {
CleanUp: false
    _14 = std::vec::Vec::<T, A>::allocator(copy _15) -> [return: bb9, unwind continue] @ Call: FnDid: 8138
}
bb 9 {
CleanUp: false
    Assign((_13, &raw const (*_14))) @ _13=&raw const (*_14) @ RawPtr
    _12 = std::ptr::read::<A>(move _13) -> [return: bb10, unwind continue] @ Call: FnDid: 26429
}
...
Based on the MIR, we can construct the dominated graph as described in Chapter 3. The analysis shows:
-
In bb0, the Vec is wrapped in ManuallyDrop
-
In bb7,
_16is the reference of_2and dereferences to access the inner Vec (_15) -
In bb8, the allocator is obtained via
Vec::allocator()on_15, producing reference _14 -
In bb9,
_13becomes a raw pointer to the allocator, which is then read viaptr::read
Contract Verification:
Typed: In our tag system, Typed implies Init, requiring Init verification. However, since Rust follows RAII principles, the alloc field is guaranteed to be initialized with the correct type in non-MaybeUninit scenarios (even when using transmute, this property must hold). Thus, the allocator stored in Vec maintains correct typing throughout, satisfying the Typed contract.
Align: The pointer type *const A matches the object type A, ensuring proper alignment per the Align contract.
ValidPtr: For non-ZST scenarios, the alloc is guaranteed to be properly initialized regardless of which constructor was used. The pointer is therefore non-null and dereferenceable, satisfying the ValidPtr contract.
Chapter 7. Utilities
This chapter introduces some utilities and gatgets of RAPx, which help printing user-friendly debug messages or implement other functionality.
Chapter 7.1 A Qucik Start of Log APIs
Library Usage
We use annotate_snippets to render code snippets with underlines and messages. The document is available at annotate_snippets which is really easy to follow.
#![allow(unused)]
fn main() {
let message = Level::Error.title("expected type, found `22`").snippet( //the title of the message
    Snippet::source(source) //the source code
        .line_start(26) //the line number from which the target code starts
        .origin("examples/footer.rs") //the filename of the source code
        .fold(true) //whether to fold the source code or not
        .annotation(
            Level::Error //message level
                .span(193..195) //the underbound and the upperbound are offsets from the starting line
                .label("expected struct `annotate_snippets::snippet::Slice`, found reference"), //the annotation to explain the underlined code
        )
        .annotation(Level::Info.span(34..50).label("while parsing this struct")), //add annotations like a chain
);
}
line_start is the starting line number of the code snippet you are interested in. The content before this line will be dropped and never count in the offset again. The .span() accepts a Range object whose upperbound and underbound are offsets from the first character of the starting line. The corresponing code segment will be underlined and annotated.
Some utilities are available for you to better use these APIs.
Utilities to Deal with the Span Objects
-
span_to_source_code(span: Span) -> String: accepts aSpanobject and returns its corresponding source code. -
span_to_first_line(span: Span) -> Span: accepts aSpanobject and returns the span corresponing to the first line of its source code or extends the span to a entire line. -
span_to_trimmed_span(span: Span) -> Span: accepts aSpanobject and returns the span corresponding to head-trimmed source code. -
span_to_filename(span: Span) -> String: accepts aSpanobject and returns the filename of the source code. -
span_to_line_number(span: Span) -> usize: accepts aSpanobject and returns its line number in the source code. -
relative_pos_range(span: Span, sub_span: Span) -> Range<usize>: accepts twoSpanobjects and return the relative position range between the two spans.
An Example
fn report_used_as_immutable(graph: &Graph, clone_span: Span, use_span: Span)
We need to annotate two code spans i.e. clone_span and use_span. The source code and filename can be acquired from the APIs above.
let code_source = span_to_source_code(graph.span);
let filename = span_to_filename(clone_span); //other spans also work here
Because there is no relationship between the clone_span and the use_span. So we use graph.span, the span of the total function, as the code background. Corresponding to this, .line_start takes graph.span as its parameter. We use relative_pos_range to compute the relative poition range. Thus it takes graph.span, the background, and clone_span, the span to underline, as parameters.
let snippet = Snippet::source(&code_source)
    .line_start(span_to_line_number(graph.span))
    .origin(&filename)
    .fold(true)
    .annotation(
        Level::Error
            .span(relative_pos_range(graph.span, clone_span))
            .label("Cloning happens here."),
    )
Then we assemble the message with title and footer.
let message = Level::Warning
    .title("Unnecessary memory cloning detected")
    .snippet(snippet)
    .footer(Level::Help.title("Use borrowings instead."));
The final code looks like:
fn report_used_as_immutable(graph: &Graph, clone_span: Span, use_span: Span) {
    let code_source = span_to_source_code(graph.span);
    let filename = span_to_filename(clone_span);
    let snippet = Snippet::source(&code_source)
        .line_start(span_to_line_number(graph.span))
        .origin(&filename)
        .fold(true)
        .annotation(
            Level::Error
                .span(relative_pos_range(graph.span, clone_span))
                .label("Cloning happens here."),
        )
        .annotation(
            Level::Error
                .span(relative_pos_range(graph.span, use_span))
                .label("Used here"),
        );
    let message = Level::Warning
        .title("Unnecessary memory cloning detected")
        .snippet(snippet)
        .footer(Level::Help.title("Use borrowings instead."));
    let renderer = Renderer::styled();
    println!("{}", renderer.render(message));
}
And the message rendered looks like:
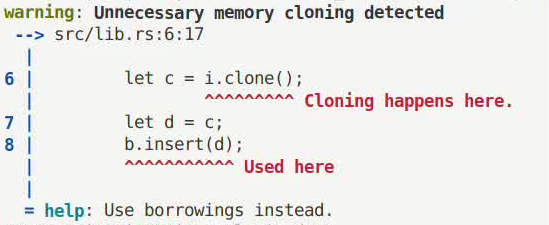
Chapter 8. Case Study
8.1 Asterinas
Asterinas uses an older toolchain (2025-02-01). To apply RAPx, a few minor modifications are required (see an example here). Then, RAPx can be applied using the following command.
cd ostd
cargo rapx -audit -- --target x86_64-unknown-none